Five Basic Candlestick Patterns To Learn & Advance Your Day Trading Career Right Now

Candlestick patterns are widely used in technical analysis to predict future price movements in financial markets. By analyzing the shape and formation of candlesticks, traders and investors can gain insights into market sentiment and make informed decisions. In this article, we will explore the top five basic candlestick patterns that are essential for pattern recognition.
Doji
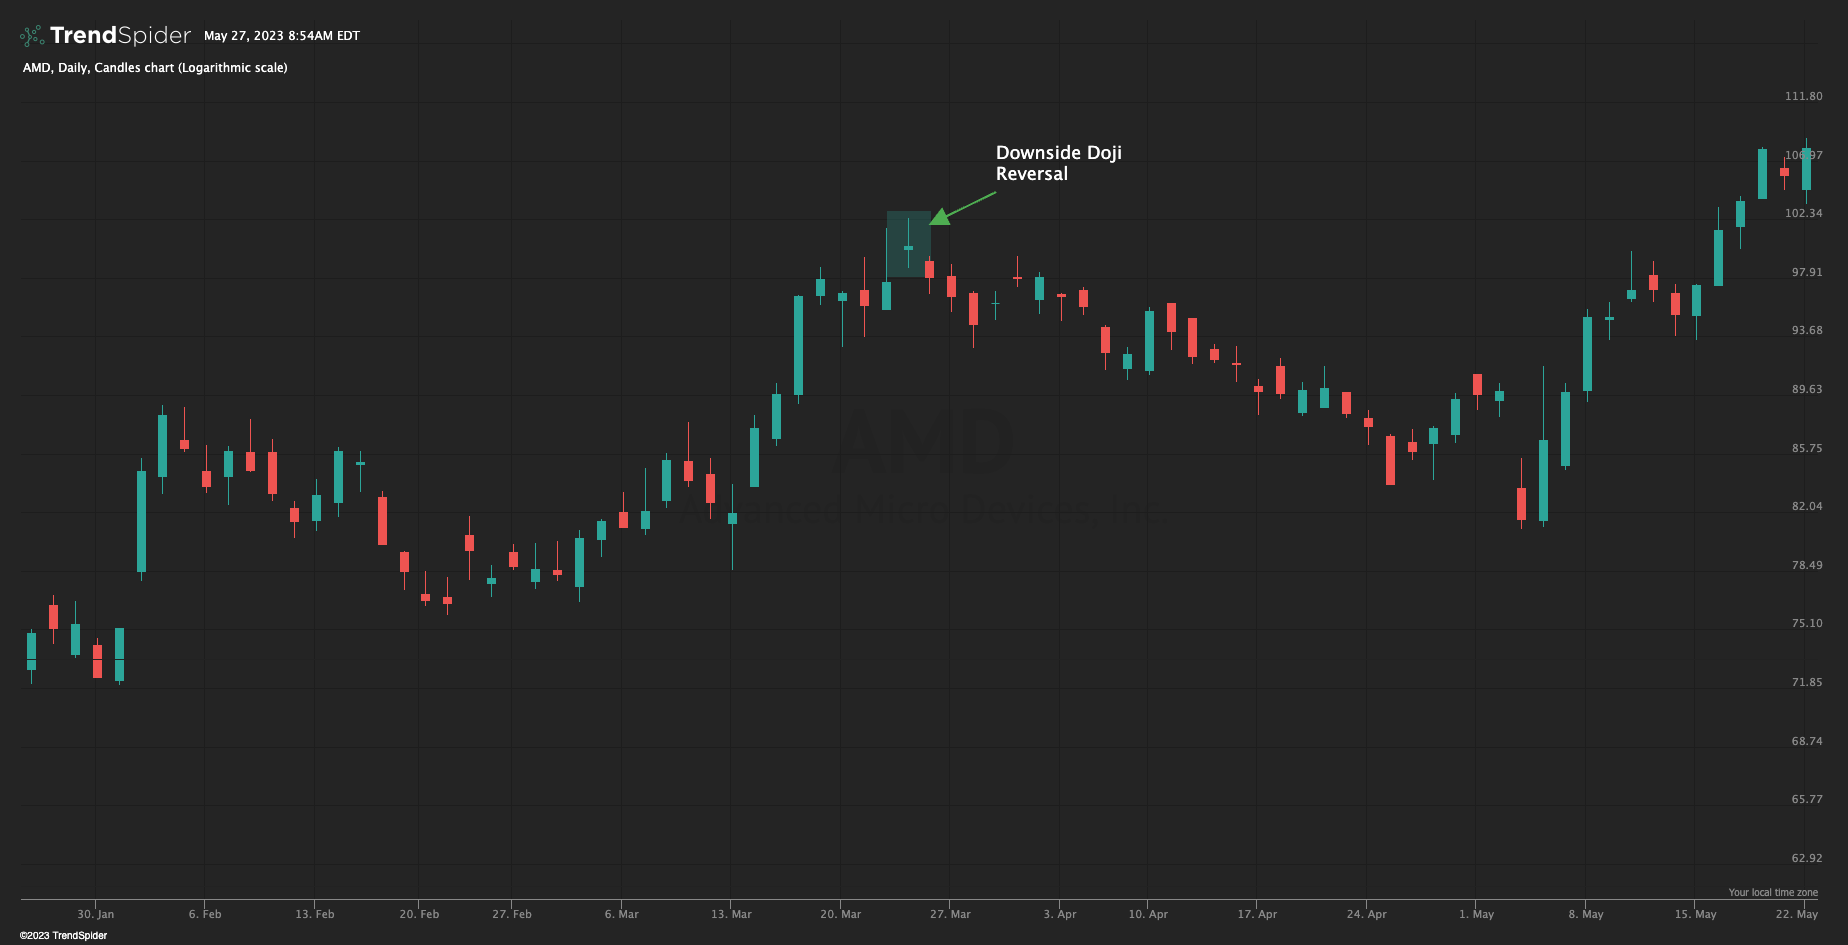
The Doji is a candlestick pattern that signifies indecision in the market. It is formed when the opening and closing prices are very close or identical, resulting in a small or nonexistent body and long upper and lower wicks. The Doji suggests that buyers and sellers are evenly matched, and a potential trend reversal or significant price movement may occur. Traders often look for confirmation from subsequent candlesticks before making any trading decisions based on a Doji pattern. There are two variations of doji's that traders also look for.
a) If the doji appears after a period of advancing prices, we often refer this to "evening star".
b) If the doji appears after a period of declining prices, it's a "morning star."
Below exmaple is a doji reversal, or evening star doji that appeared on Advanced Mircro Devices on March 23, 2023 (NASDAQ: AMD). Traders and investors would be wise to seek confirmation of the reversal by waiting until next timeframe period.
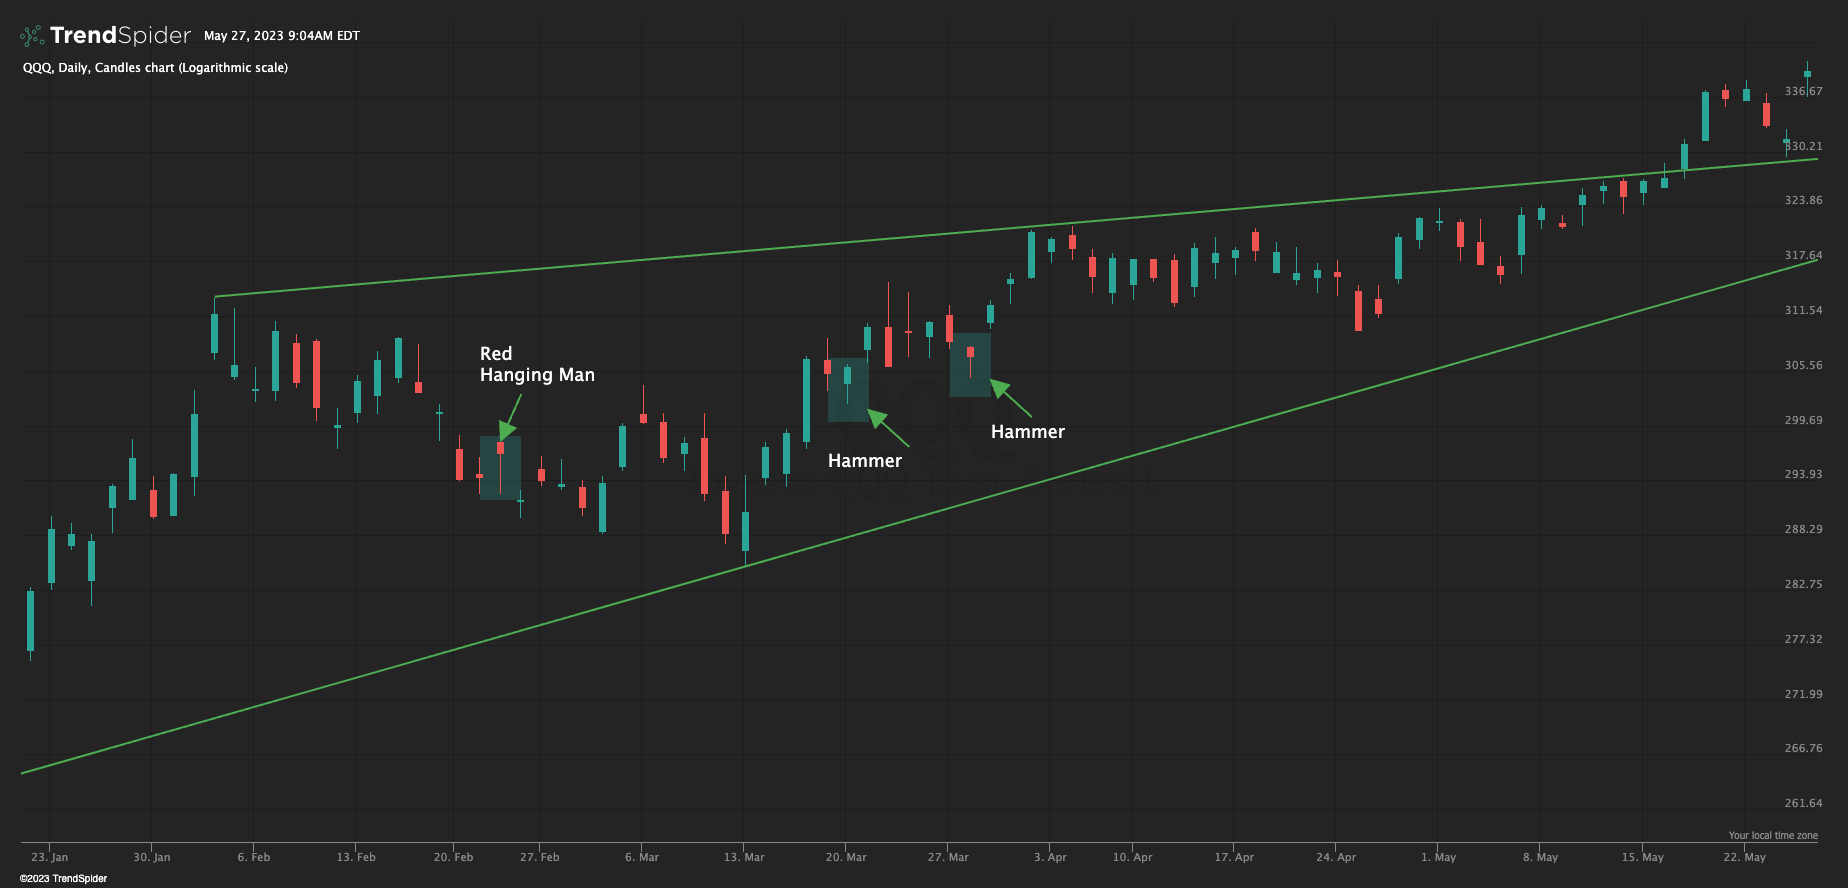
Hammer and Hanging Man
The Hammer and Hanging Man patterns are characterized by a small body and a long lower wick. The difference between the two is their placement in the trend. A Hammer forms at the bottom of a downtrend, while a Hanging Man appears at the top of an uptrend. Both patterns suggest potential trend reversals. The long lower wick represents bullish pressure, indicating that buyers are stepping in and pushing the price up. Traders often wait for confirmation in the form of a subsequent bullish candlestick before considering a long position or trend reversal.
Here's an example using Invesco QQQ Trust (NASDAQ: QQQ) on daily time frame that signaled short term reversals.
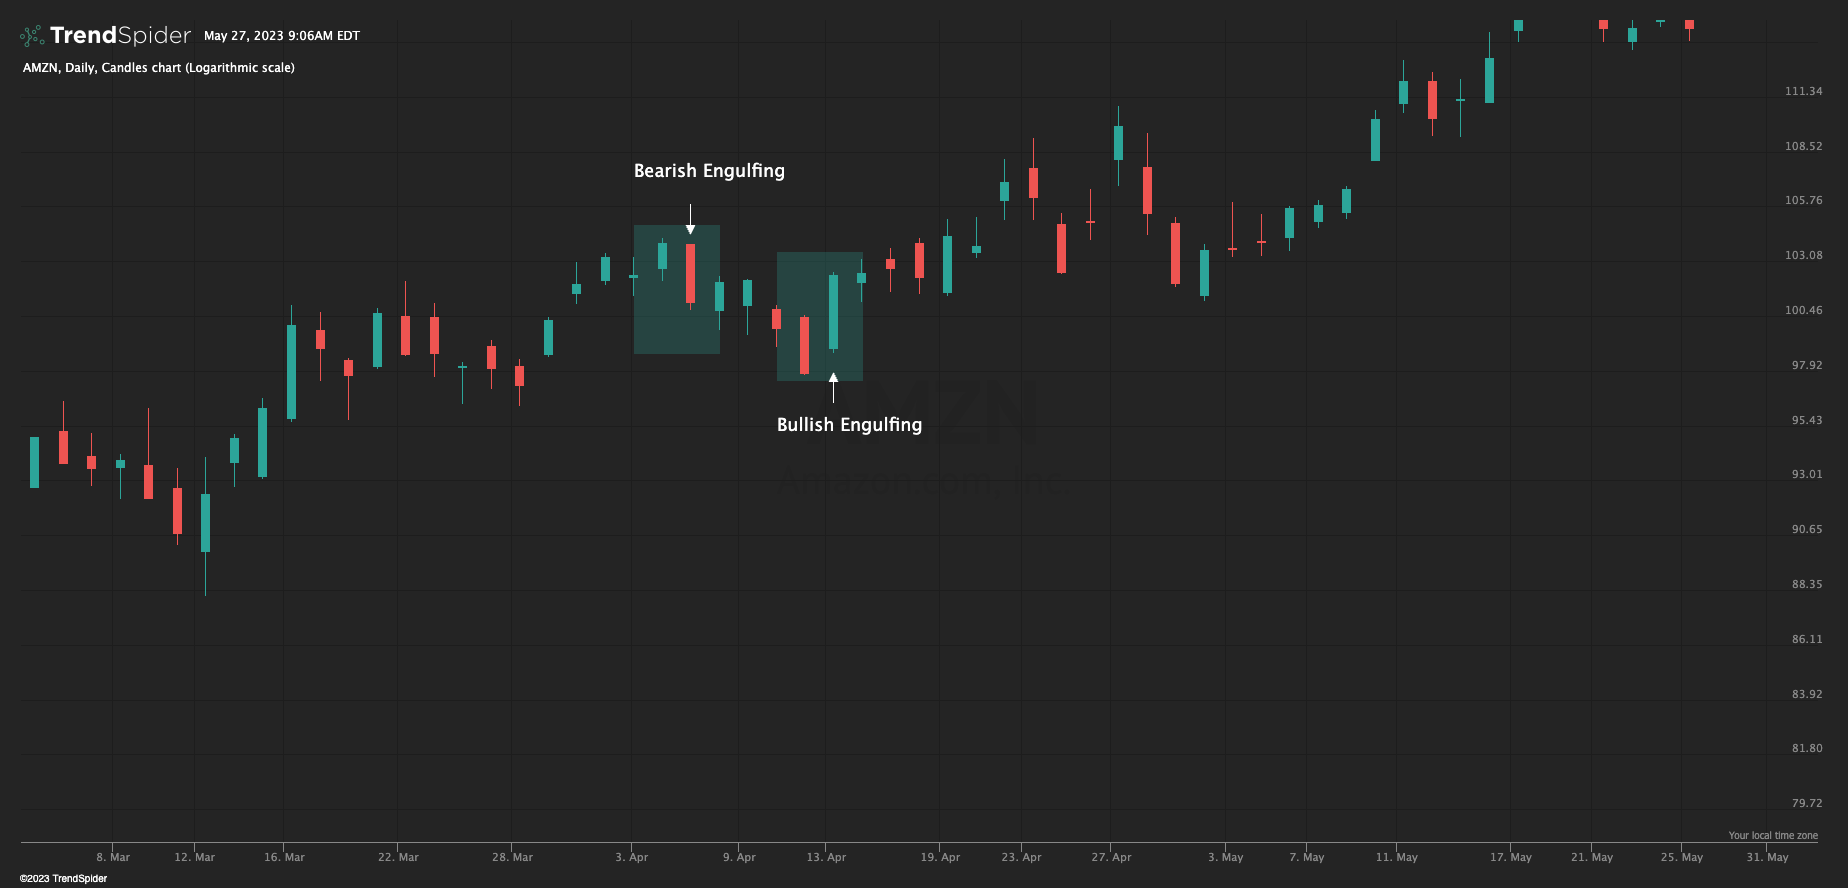
Bullish Engulfing and Bearish Engulfing:
The Engulfing patterns consist of two candlesticks, where the second candle completely engulfs the body of the previous candle. The Bullish Engulfing pattern forms at the end of a downtrend and indicates a potential reversal. It suggests that buyers have taken control and are overpowering the sellers. Conversely, the Bearish Engulfing pattern occurs at the end of an uptrend, signaling a possible reversal. It implies that sellers have gained control and are overpowering the buyers. Traders often wait for confirmation before acting on these patterns once again.
Example: Amazon (NASDAQ: AMZN) daily timeframe:
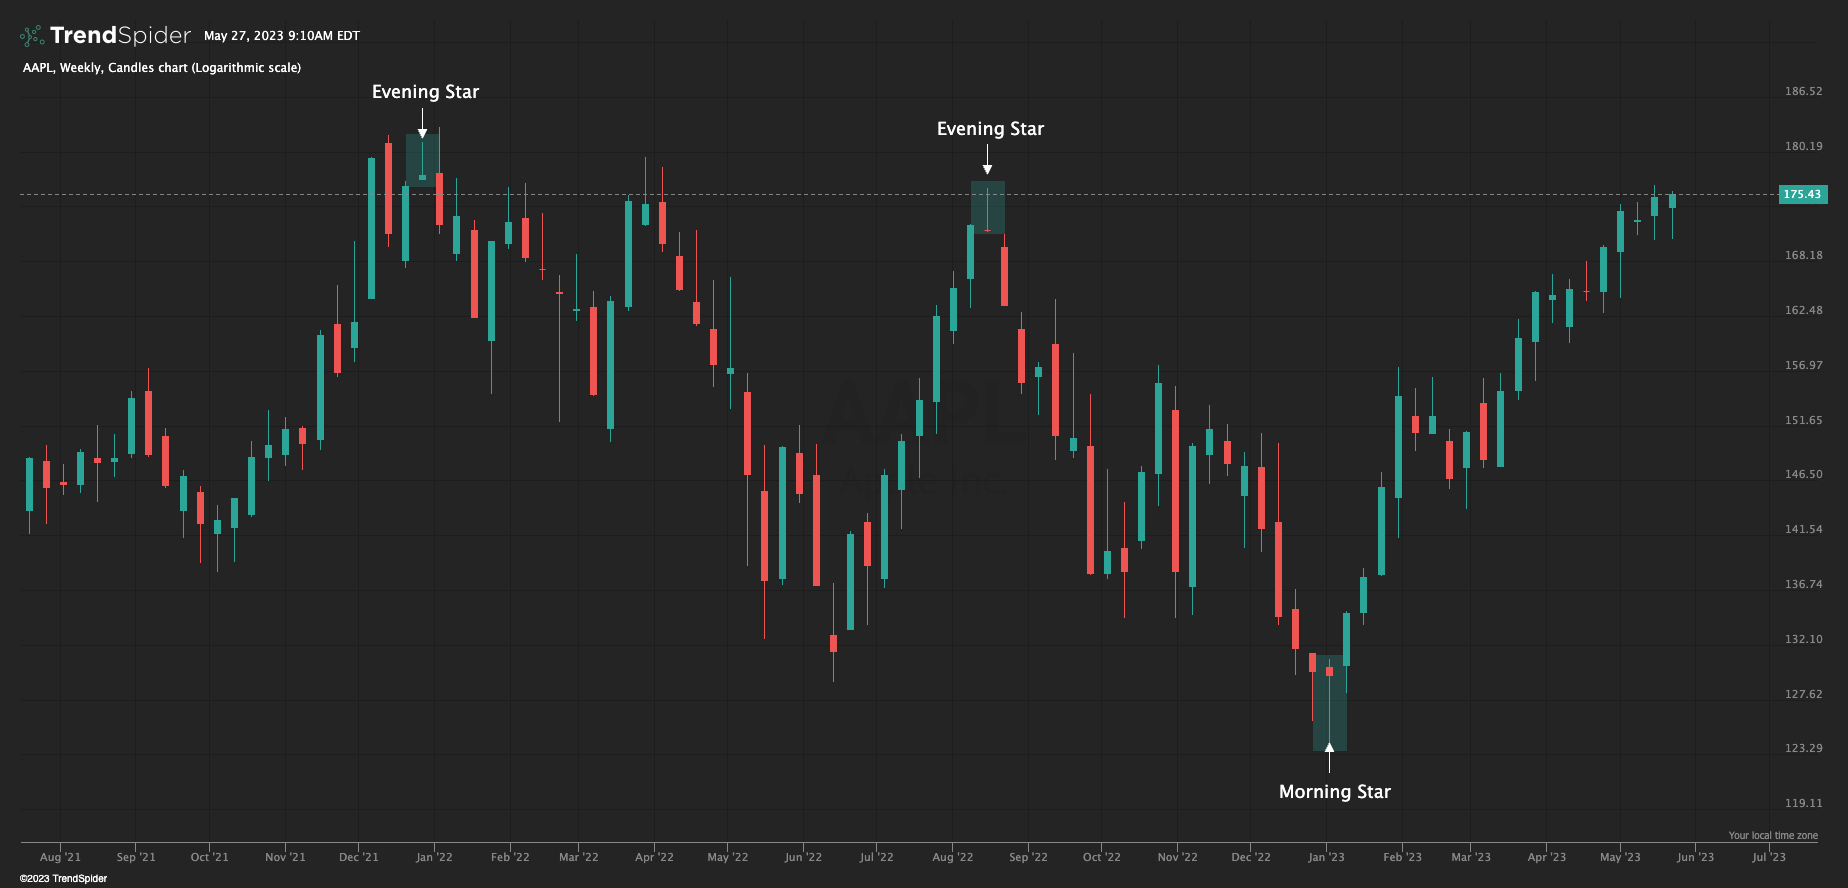
Morning Star and Evening Star:
The Morning Star and Evening Star patterns are three-candlestick formations that signify potential trend reversals. The Morning Star appears during a downtrend and consists of a bearish candlestick, followed by a small-bodied candlestick (with a gap down) that indicates indecision, and finally a bullish candlestick that confirms the trend reversal. The Evening Star pattern occurs during an uptrend and follows a similar structure but in the opposite direction. These patterns provide traders with insights into the weakening of the prevailing trend and the emergence of a potential reversal.
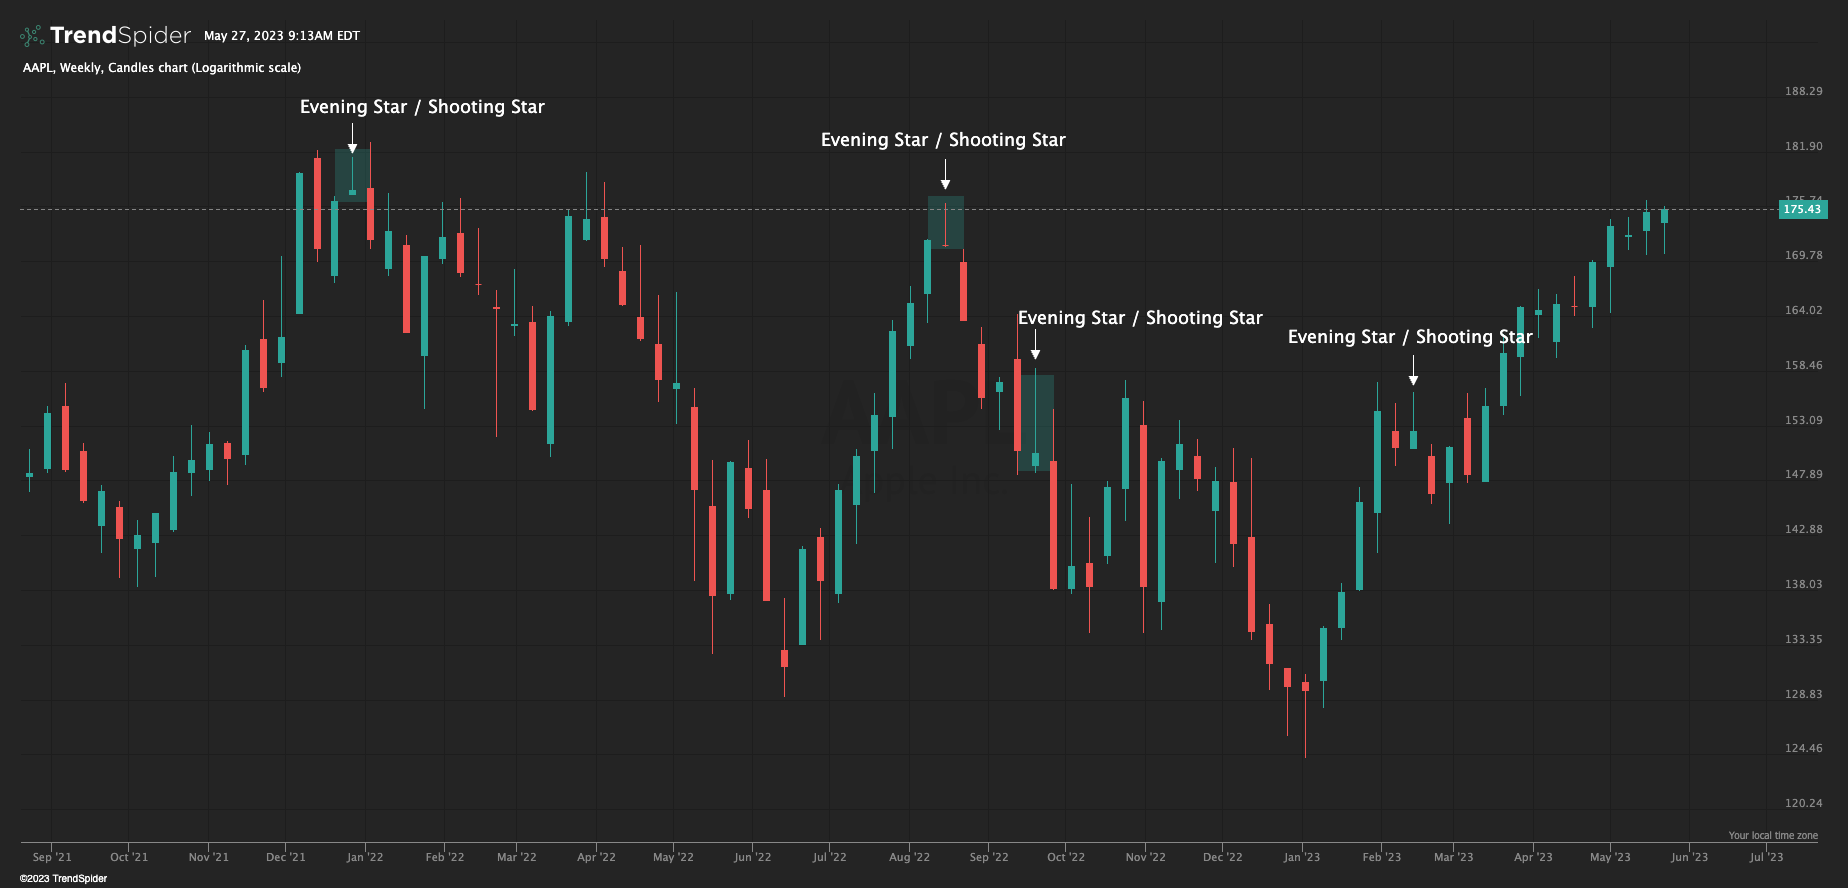
Example: Apple, Inc (NASDAQ: AAPL)
Shooting Star And Inverted Hammer:
The Shooting Star and Inverted Hammer patterns are characterized by a small body, a long upper wick, and little or no lower wick. The Shooting Star forms at the top of an uptrend, suggesting a possible reversal. It indicates that sellers have entered the market and pushed the price down, erasing most of the gains made during the session. The Inverted Hammer appears at the bottom of a downtrend and implies a potential reversal. It signifies that buyers have stepped in and pushed the price up, erasing most of the losses incurred during the session.
Using the same Apple, Inc. (NASDAQ: AAPL) as example you can see on this weekly chart, multiple shooting stars appear over the course of 2022:
Remember that candlestick patterns should be used in conjunction with other technical analysis tools and indicators to make well-informed trading decisions. Often traders use Moving Averages and oscillators.
Happy Hunting,
TRT
For more education, webinars, trading SPDR S&P 500 (NASDAQ: SPY) signup for our daily newsletter or visit us at therocktradingco.com
This article was submitted by an external contributor and may not represent the views and opinions of Benzinga.
Posted-In: candlestick contributors doji EngulfingEducation Technicals Trading Ideas General