Can This Channel Guide The S&P 500 To ATHs?

The wave counts are essentially the same since our last discussion, but the price action is starting to get interesting. Before looking at that, I want to mention that the $SPX quarterly chart is now red. This is concerning but we will wait to see how it closes. I discuss this more in the video below.
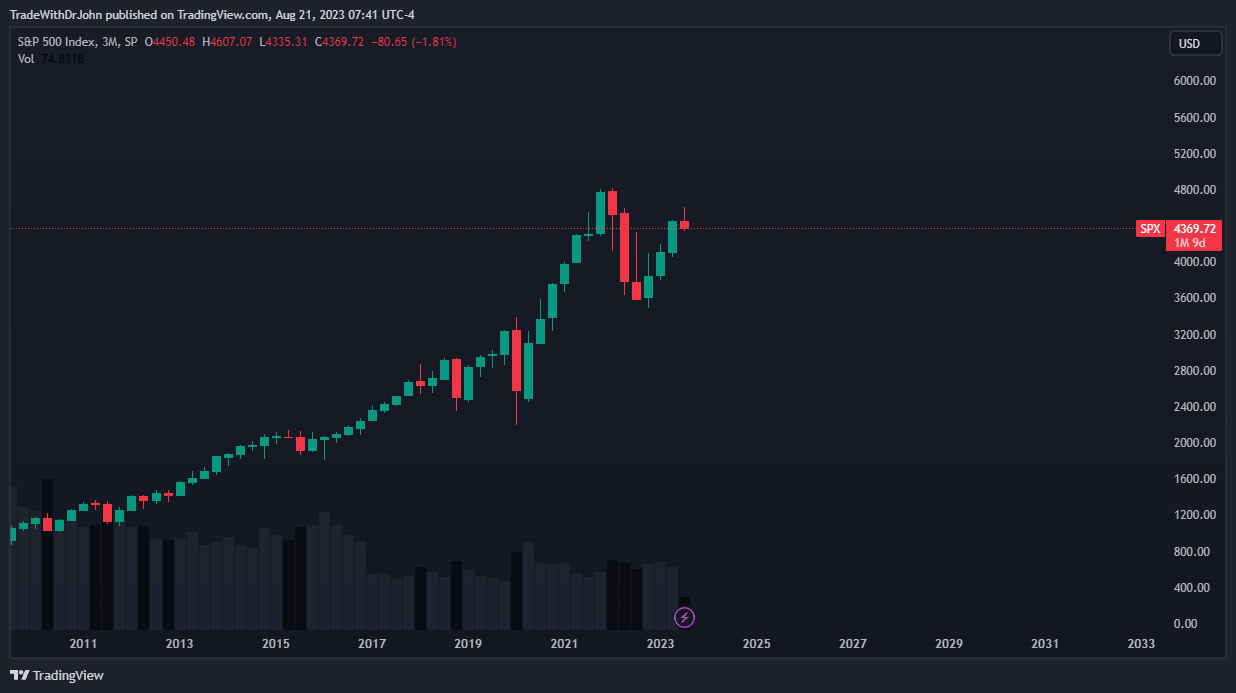
Here is the bullish/bearish count on the monthly chart. We are watching for a larger wave 4 pullback to the macro upward trendline.
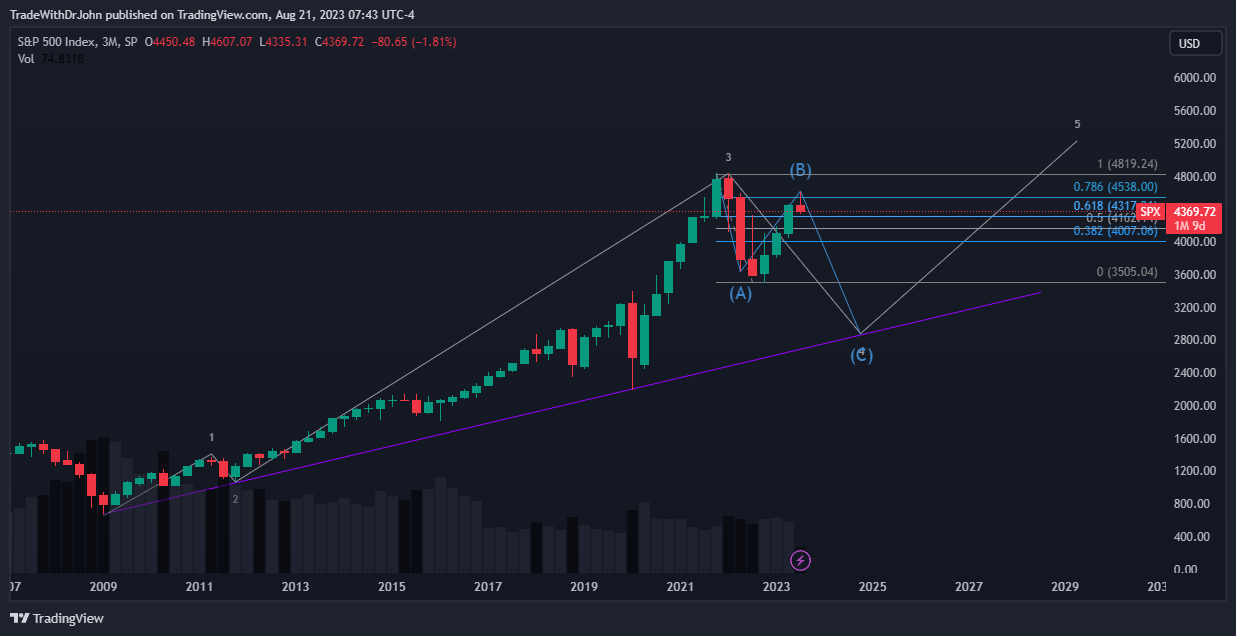
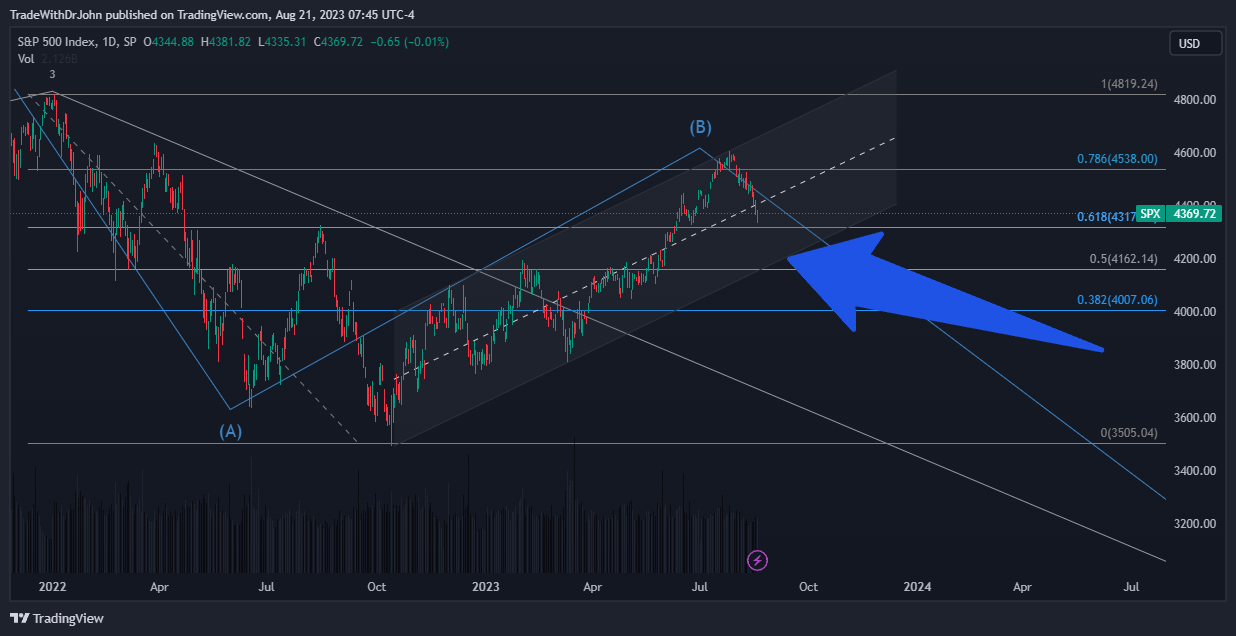
The key test will be the short-term channel. There is also the possibility that there is a wave 5 up, so if price stays in the channel, the bullish count prevails, otherwise, a loss of the channel could imply the next wave down.
Check out this video here for more information:
Dr. John
This article was submitted by an external contributor and may not represent the views and opinions of Benzinga.
Posted-In: contributors Expert Ideas SPXTechnicals Markets Trading Ideas General