1 Exxon Chart To See Before Buying In
JC Parets, of Eagle Bay Capital, recently discussed Exxon Mobil Corporation (NYSE: XOM) in a research note.
The investor said that structurally, shares of the energy giant continue to stay "below the broken uptrend line from the 2010 lows.” Exxon, he added, is now hitting “fresh multi-year lows in Relative strength."
The action is not unlike Chevron Corporation (NYSE: CVX) of late, Parets added.
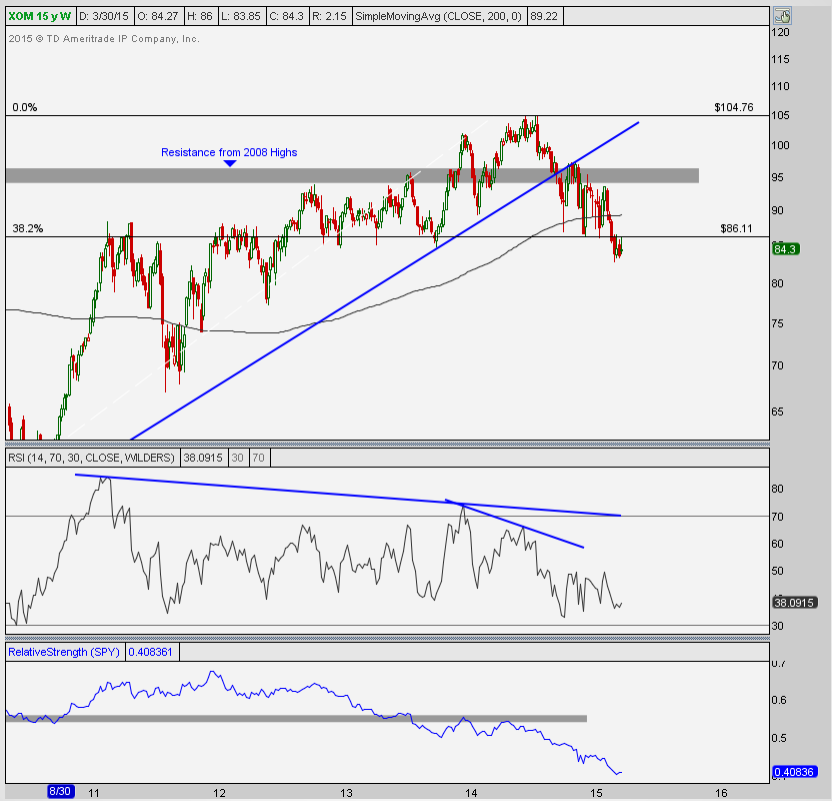
Of note, he sees no reason to be in this name structurally unless the stock is "above resistance from the 2008 highs..as well as the broken uptrend line from the 2010 lows.
"Momentum staying in a bullish range is a positive but a flat 200 week moving average is an issue," Parets concluded.
So, when would he consider a bullish position? Only if Exxon shares broke above the shaded area above, which coincides with resistance from 2008 highs in the $95 range.
Exxon closed last week at $85.56 a share.
© 2025 Benzinga.com. Benzinga does not provide investment advice. All rights reserved.
Posted-In: Eagle Bay Capital JC Parets MF1Analyst Color Technicals Trading Ideas