1 Chart IBM Investors Need To See
In his latest Dow 30 weekly report, founder of Eagle Bay Capital and Market Technician JC Parets looks into International Business Machines Corp. (NYSE: IBM) and presents one chart every investor should see.
According to Parets, “structurally IBM broke down below this multi-year consolidation and still struggling big time against the S&P500, which is why the relative strength continues to fall off a cliff and hitting 6-year lows.”
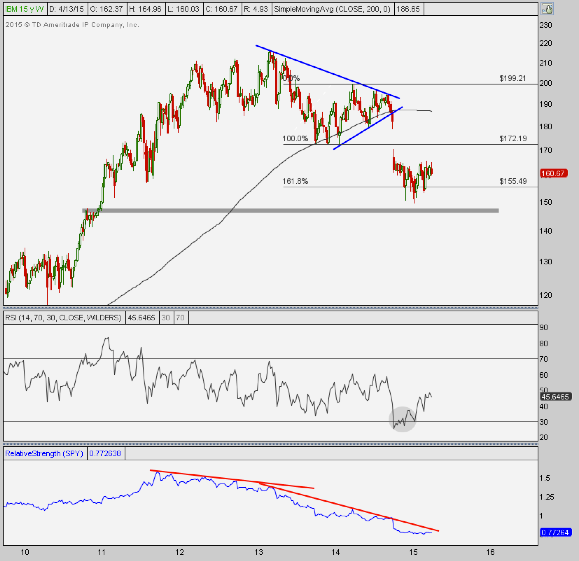
Parets said Eagle Bay “had been looking for a break below or above these converging trendlines to signal the direction of the next move. Since breaking down below support, prices have really fallen off a cliff.” This is why they wait patiently “for confirmation to trigger the next direction.”
Related Link: What Investors Should Expect From IBM's Quarterly Results Today
In December, IBM had hit their downside target near $155.50, “based on the 161.8% Fibonacci extension of the 2014 rally.”
Parets assures he “would still be selling into any strength towards former support near $172 as this is a broken market with momentum in a bad bearish range.” He added that, “the measured move based on the size of the pattern over the last few years is $148,” and he thinks “we can ultimately see those prices.”
However, based on the firm’s “target hit and nice reversal candles,” Parets believes “a mean reversion is still happening.”
Shares of IBM were up almost 3 percent on Monday, after falling 1.34 percent over the past week.
© 2025 Benzinga.com. Benzinga does not provide investment advice. All rights reserved.
Posted-In: Eagle Bay Capital JC ParetsAnalyst Color Technicals Trading Ideas