S&P 500 Hits 57 All-Time Highs In Record-Breaking 2024: Magnificent 7 Drive 30% Of Nasdaq's Surge

The year of milestones, 2024, has seen an unperturbed rise in the current bull market, which is nearly 26 months old. It is higher by more than 70% from the mid-October 2022 lows. As we wrap up the year with the possibility of a ‘Santa Rally,’ let’s recap 2024’s landmark junctures.
Major U.S. Benchmarks Scale Fresh Records
The S&P 500 Index has made 57 new all-time highs this year, hitting the last one on Dec. 6, 2024. Also, “2024 would go down as the best election year return ever,” said Ryan Detrick, the chief market strategist at Carson Research in a note.
“Going back 50 years, we found five other bull markets that had lasted at least this long and the shortest any of them lasted was five total years. Think of it like a cruise ship — once it gets moving, it can be quite hard to stop,” added Detrick
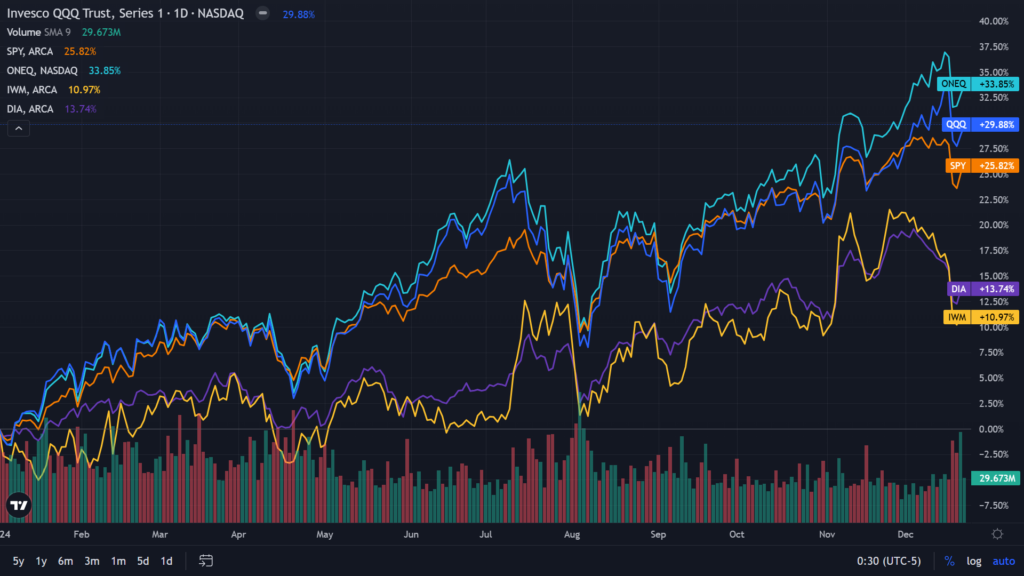
While the S&P 500 index was up 25.96% on a year-to-date basis as of Dec. 23 close, the SPDR S&P 500 ETF Trust (NYSE:SPY) rose by 25.82% in the same period.
The Dow Jones Industrial Average index, on the other hand, hit a record eight 1,000-point milestones this year. It started the year around the 37,000 level and breached the 45,000 level at the beginning of December. It took only seven trading days for the index to go from 44,000 to 45,000, the second fastest 1,000-point milestone ever. Following that the index also saw one of its longest 10-day losing streak, the first ever since 1974.
Dow was up 13.77% year-to-date as of the Dec. 23 close, whereas the SPDR Dow Jones Industrial Average ETF Trust (NYSE:DIA) gained 13.74% in the same period.
The Nasdaq 100 index which includes all the ‘magnificent seven’ stocks, unlike Dow, rose 29.98% year-to-date as Dec. 23 close. The ETF tracking the index, Fidelity NASDAQ Composite Index ETF (NASDAQ:ONEQ) rose by 33.85% in the same period. Whereas, the Invesco QQQ Trust, Series 1 (NASDAQ:QQQ) rose by 29.88% in 2024.
The smallcap index Russell 2000 was up 11.16% over the year, while iShares Russell 2000 ETF (NYSE:IWM) was up 10.97% in the same period as of the Dec. 23 close.
See Also: Is The 26-Month Bull Market Over? Here Is What Carson Research’s 50-Year Old Study Tells Us
U.S. Market Trumps The World
Among the developed economies, the S&P 500 remains the best index with a 25.96% gain on a year-to-date basis, outperforming all the other developed market indices.
While the first year of a new president’s term has usually been strong since 1897, the returns during year one of a second term haven’t been very good overall, said Detrick.
Developed Markets
Indices
YTD Performance
United States
S&P 500
25.96%
Germany
DAX
18.36%
Japan
Nikkei 225
17.27%
Hong Kong
Hang Seng
19.71%
Spain
IBEX 35
12.31%
United Kingdom
FTSE 100
4.94%
Switzerland
Swiss Market
2.85%
France
CAC 40
-3.43%
Communication, Consumer Discretionary, And Technology Lead Gains In 2024
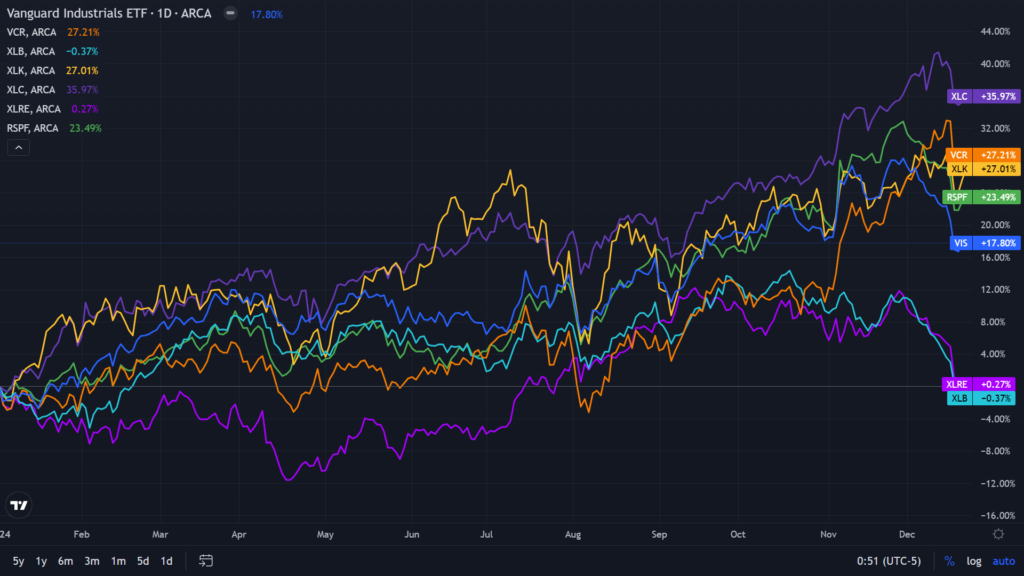
Tracking the exchange-traded funds that track the major sectors in the U.S. market, communication services emerged as the top sector for the year, followed by consumer discretionary and technology. The information technology sector has the highest weight of 31.3% in the S&P 500, followed by financials a t13.9%.
BlackRock said that they see technology companies’ earnings performing well in 2025. “We are overweight as the AI theme and earnings growth broaden. Valuations for AI beneficiaries are supported by tech companies delivering on earnings.”
Cyclical Sectors
ETFs
YTD Performance
Communication Services
Communication Services Select SPDR ETF (NYSE:XLC)
35.97%
Consumer Discretionary
Vanguard Consumer Discretionary ETF (NYSE:VCR)
27.21%
Technology
Technology Select Sector SPDR ETF (NYSE:XLK)
27.01%
Financials
Invesco S&P 500 Equal Weight Financial ETF (NYSE:RSPF)
23.48%
Industrials
Vanguard Industrials ETF (NYSE:VIS)
17.80%
Real Estate
Real Estate Select Sector SPDR (NYSE:XLRE)
0.27%
Materials
Materials Select Sector SPDR Fund (ARC: XLB)
-0.37%
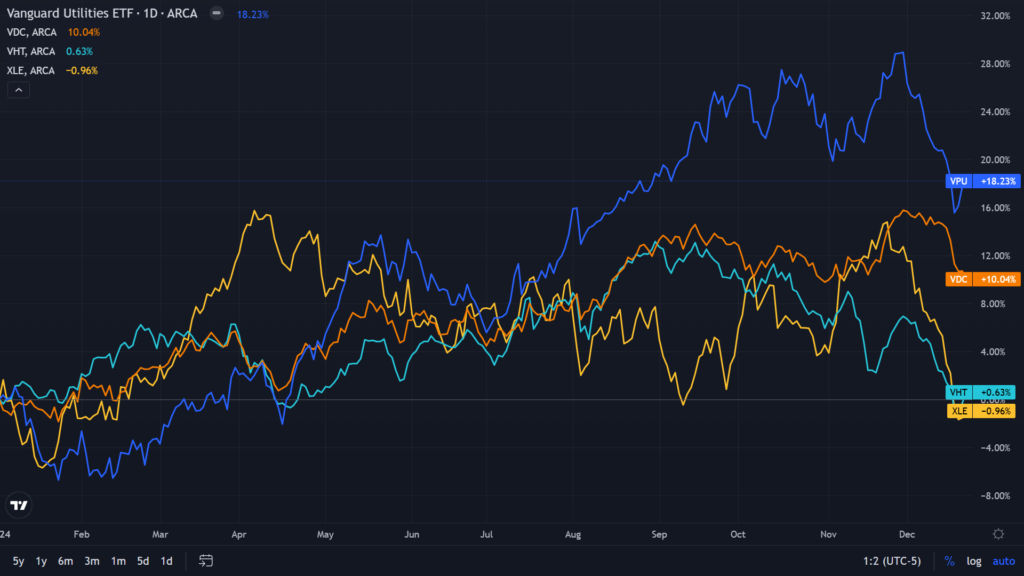
Among the defensive sectors, utilities emerged as a winner, whereas energy was an underperformer. Consumer staples, energy, and utilities take up 5.7%, 3.4%, and 2.5% weight, respectively in the S&P 500 index.
As per Morgan Stanley, the energy sector faces a divided future. Trump's deregulation could benefit traditional energy, but the outlook for oil is uncertain due to potential oversupply and weak global demand, especially from China. In contrast, natural gas may see growth from strong European demand and increased domestic use for electrification and AI-powered data centers. The clean energy sector could face challenges, if Trump rollbacks Biden's 2022 Inflation Reduction Act tax credits. However, a full repeal seems unlikely due to the benefits for Republican states.
Top S&P 500 Performers In 2024
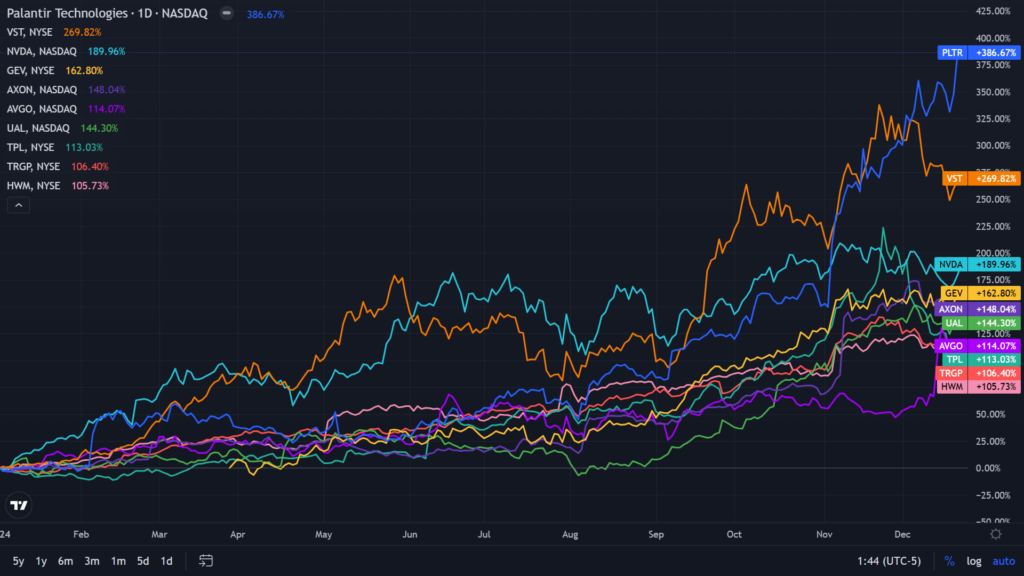
Palantir was the top performer within the S&P 500 index this year, as it zoomed 386.67% year-to-date, as of Dec. 23 close. Vistra and Nvidia followed Palantir to advance 269.82% and 189.95% in the same period.
S&P 500 Stocks
YTD Performance
Palantir Technologies Inc. (NASDAQ:PLTR)
386.67%
Vistra Corporation (NYSE:VST)
269.82%
NVIDIA Corporation (NASDAQ:NVDA)
189.95%
GE Vernova Inc. (NYSE:GEV)
162.80%
Axon Enterprise Inc. (NASDAQ:AXON)
148.04%
United Airlines Holdings Inc. (NASDAQ:UAL)
144.30%
Broadcom Inc. (NASDAQ:AVGO)
114.07%
Texas Pacific Land Corp. (NYSE:TPL)
113.03%
Targa Resources Corp. (NYSE:TRGP)
106.40%
Howmet Aerospace Inc. (NYSE:HWM)
105.73%
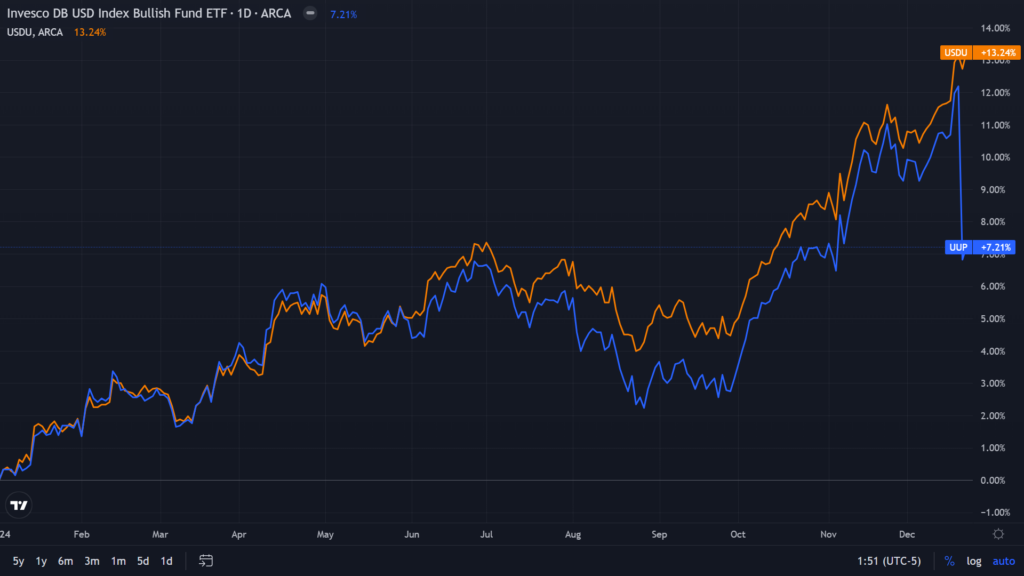
U.S. Dollar Surges Over 6% In 2024
The Dollar index was up 6.72% year-to-date with a 52-week range of 100.1570 to 108.5410 per unit. If the Greenback can hold on to these gains, the currency would leave behind the second-best year since 2015.
The UDS’s demand has been rising due to the “Uncertainties arising from expected Trump's policies and hawkish comments from the Fed towards rate cycle,” said Kunal Sodhani, vice president of the global trading center at Shinhan Bank.
According to Franklin Templeton, “The Fed easing cycle will be a dominant factor for the USD. The two main comparisons we draw against the Fed cyclically, interest-rate-wise, are emerging markets, and Japan.”
WisdomTree Bloomberg US Dollar Bullish Fund (NYSE:USDU) was up 13.24% on a year-to-date basis, as of Dec. 23 close, where as Invesco DB US Dollar Index Bullish Fund (NYSE:UUP) advanced by 7.21% in the same period.
Read Next
Photo courtesy: Shutterstock
© 2025 Benzinga.com. Benzinga does not provide investment advice. All rights reserved.
Posted-In: Blackrock Carson Research Franklin TempletonAnalyst Color Equities News Markets ETFs