Retail Investors More Optimistic Heading Into April

Let's begin with a bit of a refresher.
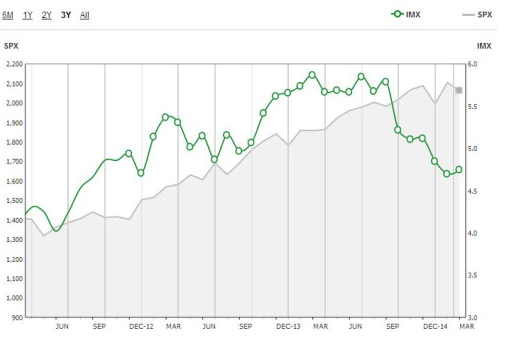
In last month's IMX release, we noted that for the first time in a very long time, TD Ameritrade retail clients were net sellers of equities and that their level of behavioral sentiment hit a new two year low.
And what happened in the ensuing weeks in the stock market? It seems that their defensive positioning served them well. The S&P 500, Dow Jones Industrial Average and NASDAQ all ended the period between 2% and 3% lower than where they began.
On to the March results. In March, the IMX advanced about 1% to 4.75 from 4.70. So our clients have only increased their equity market exposure moderately from what was otherwise a two year low.
Volatility in the S&P 500 as measured by the VIX was at a year-to-date low to begin the period, and remained low relative to recent levels throughout the month. Both equity markets and Treasury bonds traded higher immediately following the Federal Reserve policy statement, which indicated that the timing of any rate increase would still be dependent upon the Fed’s economic goals – and that the country had not satisfied these goals yet.
Crude oil prices also continued to play a role in the markets, as their levels declined through the first half of the month on concerns about U.S. storage capacities reaching their limits.
There are two primary factors which drove the IMX score only modestly higher this month. First, our retail clients were broad net buyers of the equity markets. We’re not talking about a little buying here and a little buying there.
There was strength in buying. But the main reason that the IMX score didn’t advance in a more pronounced manner is because of the second factor: there was a reduction in volatility relative to the S&P 500 for some widely held stocks in TD Ameritrade client portfolios.
Apple (NASDAQ: AAPL), Facebook (NASDAQ: FB), Bank of America (NYSE: BAC) and Alibaba (NYSE: BABA) all saw reductions in volatility during the month relative to the S&P 500. The reduction in portfolio beta served to moderate the rise in equity market exposure against the net buying activity.
What Were They Buying?
Continued price pressure on oil producers and energy-related stocks appeared to translate into buying opportunities for clients, as Exxon Mobile Corp. (NYSE: XOM), Chesapeake Energy Corp. (NYSE: CHK) and SeaDrill Limited (NYSE: SDRL) were all net buys and saw declines in their values over the period. Names making headlines were also popular buys. Apple Inc. (NASDAQ: AAPL) was net buy as the media and investors speculated about a dividend increase coming next month and the possibility of a special dividend being announced. The Lumber Liquidators Holdings, Inc. (NYSE: LL) stock price plunged at the end of February and continued to trade lower in March, which seemed to prompt some clients to buy the stock.
Additional popular names bought included Tesla Motors (NASDAQ: TSLA), Disney (NYSE: DIS), and Visa (NYSE: V).
What Were They Selling?
March saw net selling in popular financial names such as Citigroup (NYSE: C) and American International Group (NYSE: AIG). Both companies had court settlements announced in March and had rebounded back to near levels of resistance after hitting year-to-date lows in late January. Well-known dividend payers Ford Motor Co. (NYSE: F) and McDonald's Corporation (NYSE: MCD) saw year-to-date highs in March and were also net sells. Alibaba Group (NYSE: BABA), which has declined in price since its disappointing earnings result in January, appeared to find a level of support and was net sold as well.
Additional popular names sold included Yahoo! Inc. (NASDAQ: YHOO), Amazon (NASDAQ: AMZN) and Sirius XM (NASDAQ: SIRI).
For more information on the Investor Movement Index®, including historical IMX data going back to December 2010, to view the full report from March 2015, or to sign up for future IMX news alerts, please visit www.tdameritrade.com/IMX. Additionally, TD Ameritrade clients can chart the IMX using the symbol $IMX in either the thinkorswim or TD Ameritrade Mobile Trader platforms.
This piece was originally posted here by Nicole Sherrod on April 6, 2015.
Disclosures: Past performance of a security, strategy or index is no guarantee of future results or investment success.
Historical data should not be used alone when making investment decisions. Please consult other sources of information and consider your individual financial position and goals before making an independent investment decision.
The IMX is not a tradable index. The IMX should not be used as an indicator or predictor of future client trading volume or financial performance for TD Ameritrade.
Commentary provided for educational purposes only. Inclusion of specific security names in this commentary does not constitute a recommendation from TD Ameritrade to buy, sell, or hold.
Investing in stocks involves risks, including loss of principal. Past performance is no guarantee of future results.
© 2015 TD Ameritrade IP Company, Inc. All rights reserved. Used with permission. TD Ameritrade, Inc., member FINRA/SIPC.
This article was submitted by an external contributor and may not represent the views and opinions of Benzinga.
© 2025 Benzinga.com. Benzinga does not provide investment advice. All rights reserved.
Posted-In: Nicole Sherrod TD AmeritradeEconomics Best of Benzinga