RSI Vs. Stochastic: Which Is The Best Oscillator For Trading Big Tech Stocks?
In this article, we compare two of the most widely used technical indicators in trading: the RSI (Relative Strength Index) and the Stochastic Oscillator. These momentum-based tools help traders identify overbought and oversold conditions in financial markets by analyzing the strength and direction of price movements. Both are normalized oscillators, meaning their values fluctuate between 0 and 100.
To test their real-world effectiveness, we developed two automated trading strategies using each oscillator and applied them to a basket of high-performing U.S. tech stocks, the so-called “Magnificent 7” from the S&P 500 index:
- AAPL (Apple)
- MSFT (Microsoft)
- GOOGL (Alphabet)
- AMZN (Amazon)
- TSLA (Tesla)
- NVDA (Nvidia)
- META (Meta)
We’ll analyze key differences between the two indicators in terms of signal frequency, profitability, and robustness, based on backtests from 2010 to today. Let’s find out which one performs better in systematic trading on high-cap tech stocks.
How the RSI (Relative Strength Index) Works in Trading
Developed by Welles Wilder, the RSI measures the strength of a trend by comparing the average gains and losses over a specified period. Wilder originally suggested using a 14-period length, with 30 and 70 as the oversold and overbought levels respectively.
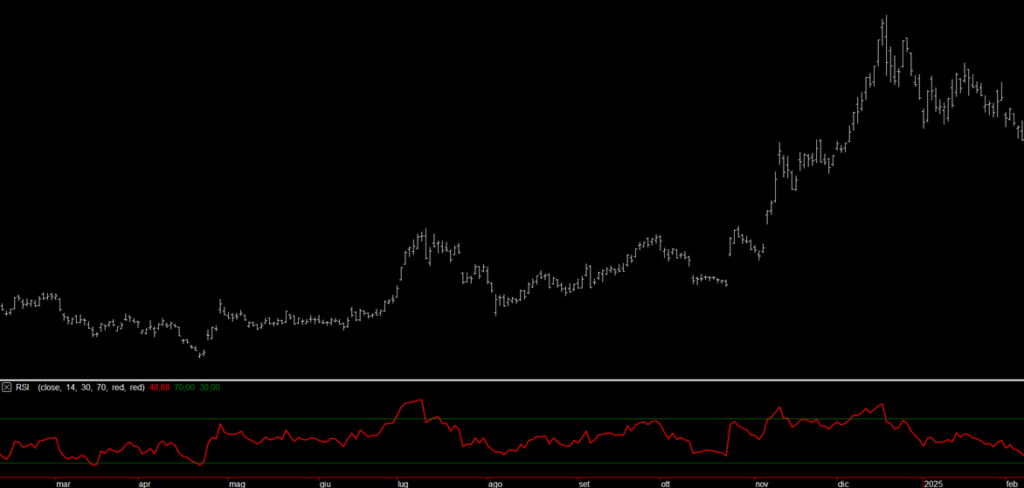
Figure 1: RSI Indicator applied to Tesla (TSLA).
Understanding the Stochastic Oscillator: Structure and Key Differences from RSI
Created by George Lane, the Stochastic Oscillator is also a normalized tool oscillating between 0 and 100. Unlike RSI, it’s composed of two lines:
- %K, the main line, which measures the current closing price relative to the high/low range over the selected period (usually 14 bars).
- %D, a 3-period moving average of %K.
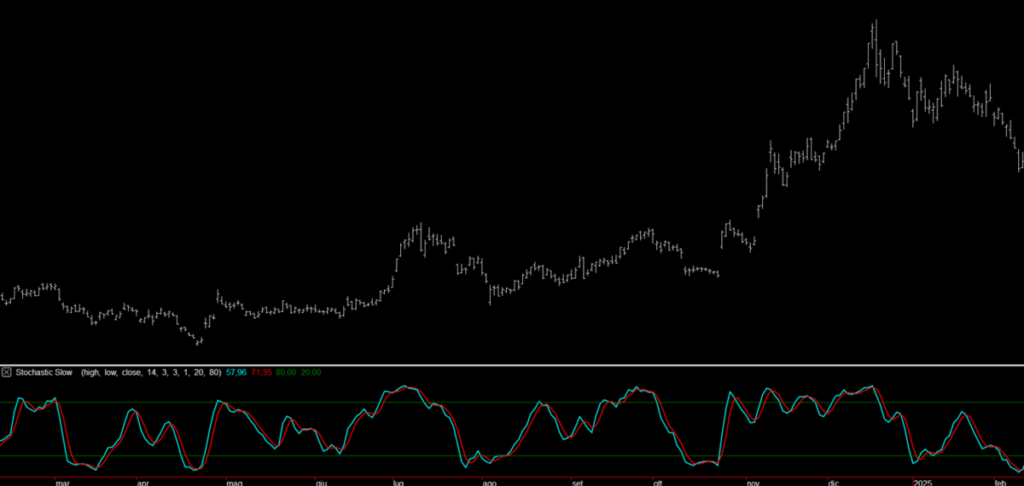
Figure 2: Stochastic Oscillator on Tesla (TSLA).
Trading System Rules Using Default RSI and Stochastic Settings
We built both strategies using a daily timeframe and limited the entries to long-only positions, in line with the long-term bullish bias of the selected stocks. Whenever an exit signal appears, the position is simply closed, there's no reversal or short entry involved.
For the RSI-based strategy, we used the default parameters: a 14-period RSI with oversold and overbought thresholds set at 30 and 70, respectively. A long position is opened when the RSI drops below the lower threshold (30) and is closed once it crosses back above the upper threshold (70).
In the case of the Stochastic Oscillator, we also kept the default settings: 14 periods for the %K line and thresholds at 20 and 80 for oversold and overbought zones. A trade is initiated when the %K line crosses above the %D line, but only if the %K is already in the oversold area (below 20). Conversely, the trade is closed when %K crosses below %D while being in the overbought zone (above 80).
To further refine the strategy and prevent trades from remaining open indefinitely in the absence of a clear exit signal, we implemented a time-based exit after 10 bars, equivalent to about two trading weeks.
Each trade was executed with a fixed position size of $10,000, while the initial portfolio capital was set at $100,000, ensuring the platform could manage multiple trades simultaneously.
Backtest Results Using Default Parameters: RSI vs Stochastic
Looking at the first set of results, covering the period from 2010 to today, both strategies demonstrated a fair degree of consistency in their performance. However, the strategy based on the RSI clearly stood out as more effective overall, particularly in terms of the regularity of the equity curve and the average profit per trade. To be precise, the RSI strategy achieved an average trade value of $235, while the Stochastic-based system stopped at $78.
It’s also worth noting that, with the default settings applied, both systems generated a relatively low number of trades. The RSI strategy, for instance, triggered only 167 operations across the full basket of seven stocks, a consequence of using longer lookback periods that naturally produce fewer entry signals.
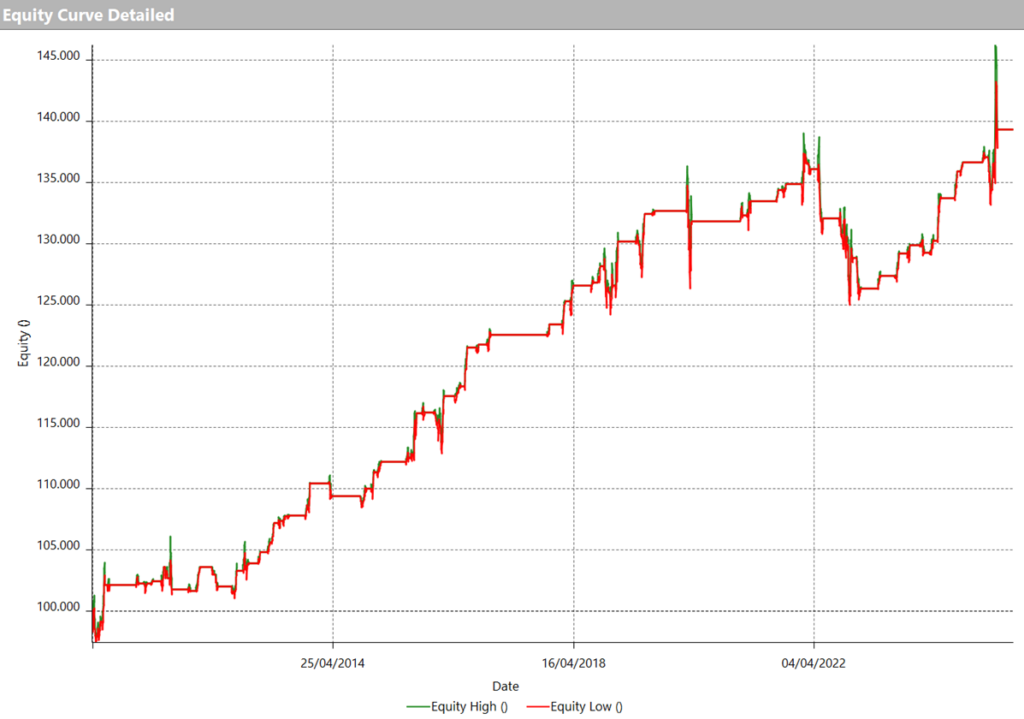
Figure 3. Equity line of the "RSI" strategy with default parameters applied to the Magnificent 7 stock basket.
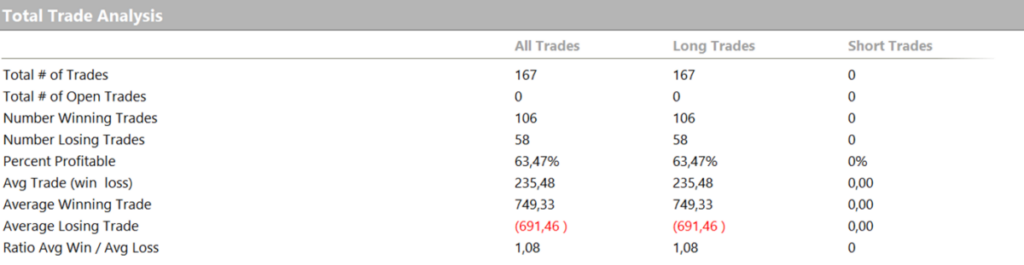
Figure 4. Total Trade Analysis of the strategy based on the RSI oscillator.
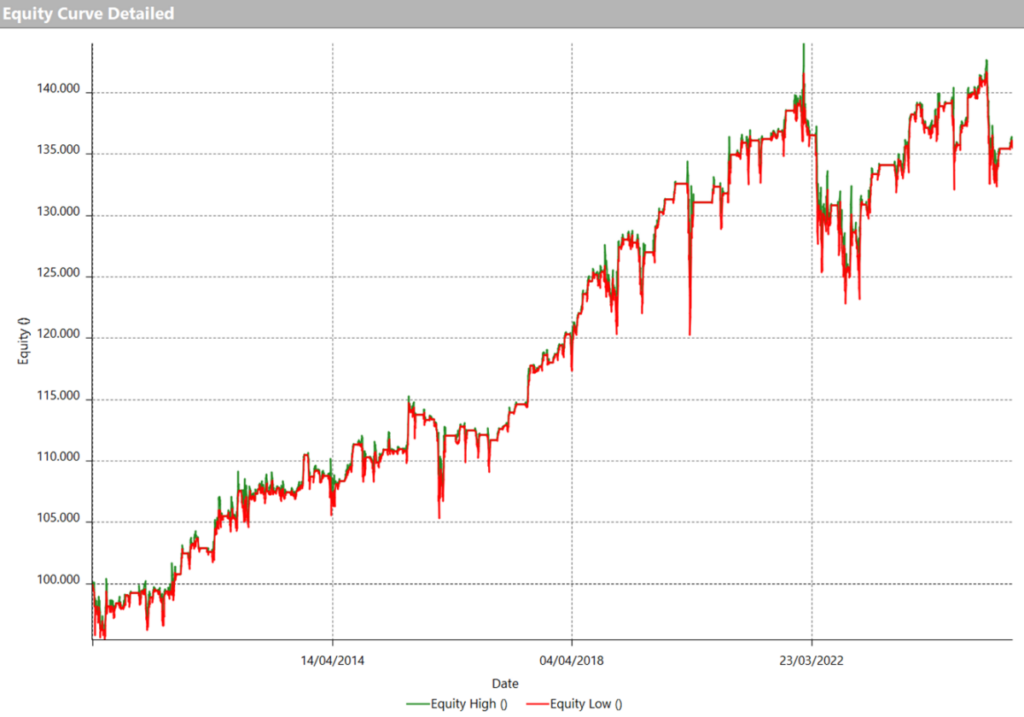
Figure 5. Equity line of the "Stochastic" strategy with default parameters applied to the Magnificent 7 stock basket.
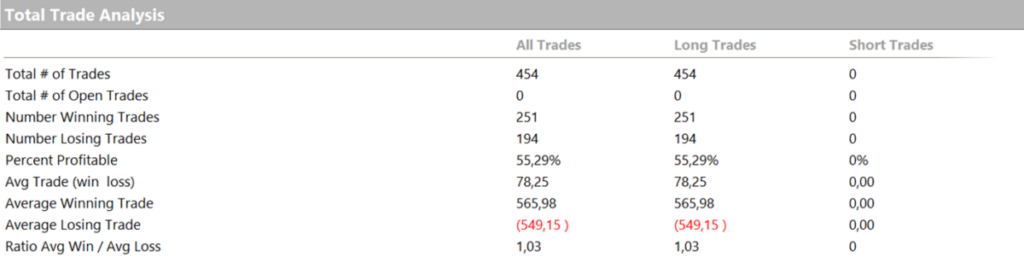
Figure 6. Total Trade Analysis of the strategy based on the Stochastic oscillator.
RSI vs Stochastic: Testing New Parameters to Increase Trade Frequency
After noticing that both strategies, when using standard parameters, generated a relatively limited number of trades, we decided to test new inputs with the goal of increasing the sample size and potentially improving net profit. A higher number of trades allows for more statistically reliable results and offers a better assessment of each strategy's robustness over time.
Specifically, for both the RSI and the Stochastic Oscillator, we applied a shorter calculation period of 5, which roughly corresponds to one trading week. We also used tighter threshold levels to define overbought and oversold zones, setting them at 40 and 60, respectively.
Backtest with New Parameters: Comparing RSI and Stochastic Results
Analyzing the results obtained using the new parameters, shown in Figures 7 and 8 for the RSI, and Figures 9 and 10 for the Stochastic, we can clearly see an improvement in net profit.
The RSI-based strategy, in particular, shows a significant increase in the number of trades: it goes from just 167 trades to an impressive 1,400, with an average trade value of $99. This higher trading frequency leads to a much more substantial net profit and, more importantly, produces an equity curve that grows steadily and consistently over time (see Figure 7), showing particularly strong performance in recent years.
The Stochastic strategy also benefits from the new parameters, increasing its number of trades to 1,118, with an average trade value of $83 (see Figure 10). However, when observing the equity line in Figure 9, its progression appears less smooth than that of the RSI, with a noticeable period of sideways movement toward the end of the test period.
Overall, the new settings, with a calculation period of 5 and tighter thresholds at 40 and 60,resulted in a much more active and profitable strategy. The RSI, in particular, seems to respond better to this kind of configuration, managing to combine high trade frequency with solid long-term performance.
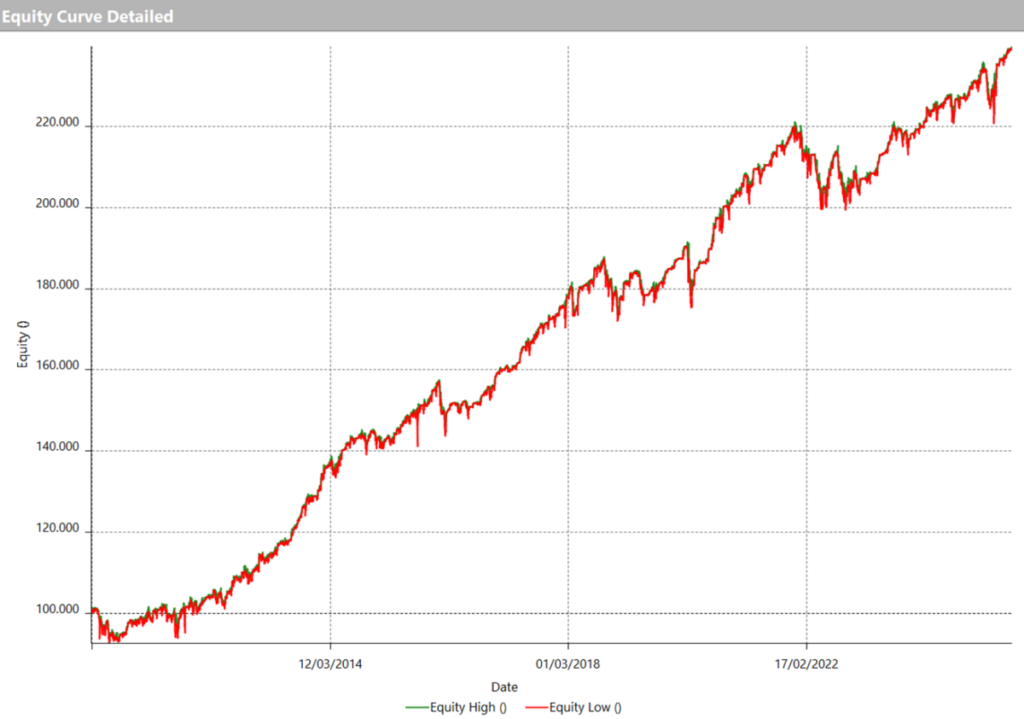
Figure 7. Equity line of the strategy based on the RSI oscillator with optimized parameters.
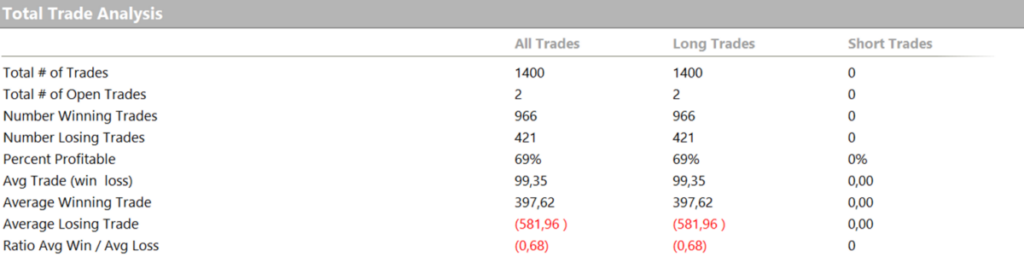
Figure 8. Total Trade Analysis of the strategy based on the RSI with optimized parameters.
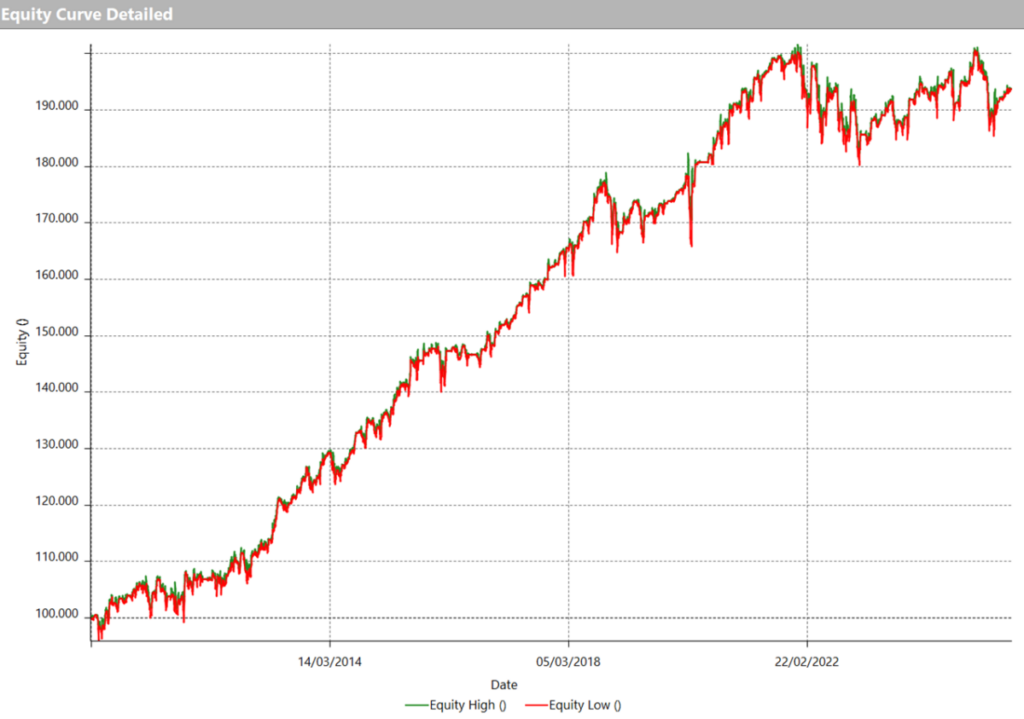
Figure 9. Equity line of the strategy based on the Stochastic oscillator with optimized parameters.
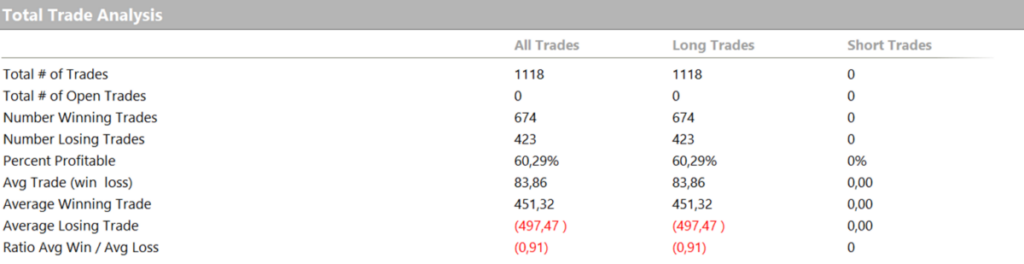
Figure 10. Total Trade Analysis of the strategy based on the Stochastic with optimized parameters.
Conclusions: Which Oscillator Performs Better in Systematic Trading on Big Tech Stocks?
In this article, we’ve shown how it’s possible to build effective trading strategies using two well-known oscillators: RSI and Stochastic. We’ve seen how making key adjustments, such as modifying the calculation period and the overbought/oversold thresholds, can lead to a meaningful improvement in performance, especially in terms of net profit.
The results suggest that using more responsive parameters for the RSI tends to yield a more consistent and reliable strategy, particularly in recent market conditions.
That said, these strategies are just a starting point. There’s room for further refinement by incorporating elements like stop loss, take profit levels, or additional filters such as the 200-period moving average to improve signal quality.
It’s also important to note that these backtests were run on stocks with strong bullish trends over the past several years, which may have contributed to the positive results. The next logical step will be to test these systems using other trading logics and in different market environments.
That’s all for now! Until next time, happy trading!
Benzinga Disclaimer: This article is from an unpaid external contributor. It does not represent Benzinga’s reporting and has not been edited for content or accuracy.
Posted-In: contributors Expert IdeasEducation Technicals Opinion General