Momo Crowd Behavior Triggers A Yellow Flag For Stock Market, Tariffs Cost GM $1.1B
To gain an edge, this is what you need to know today.
Caution For The Stock Market
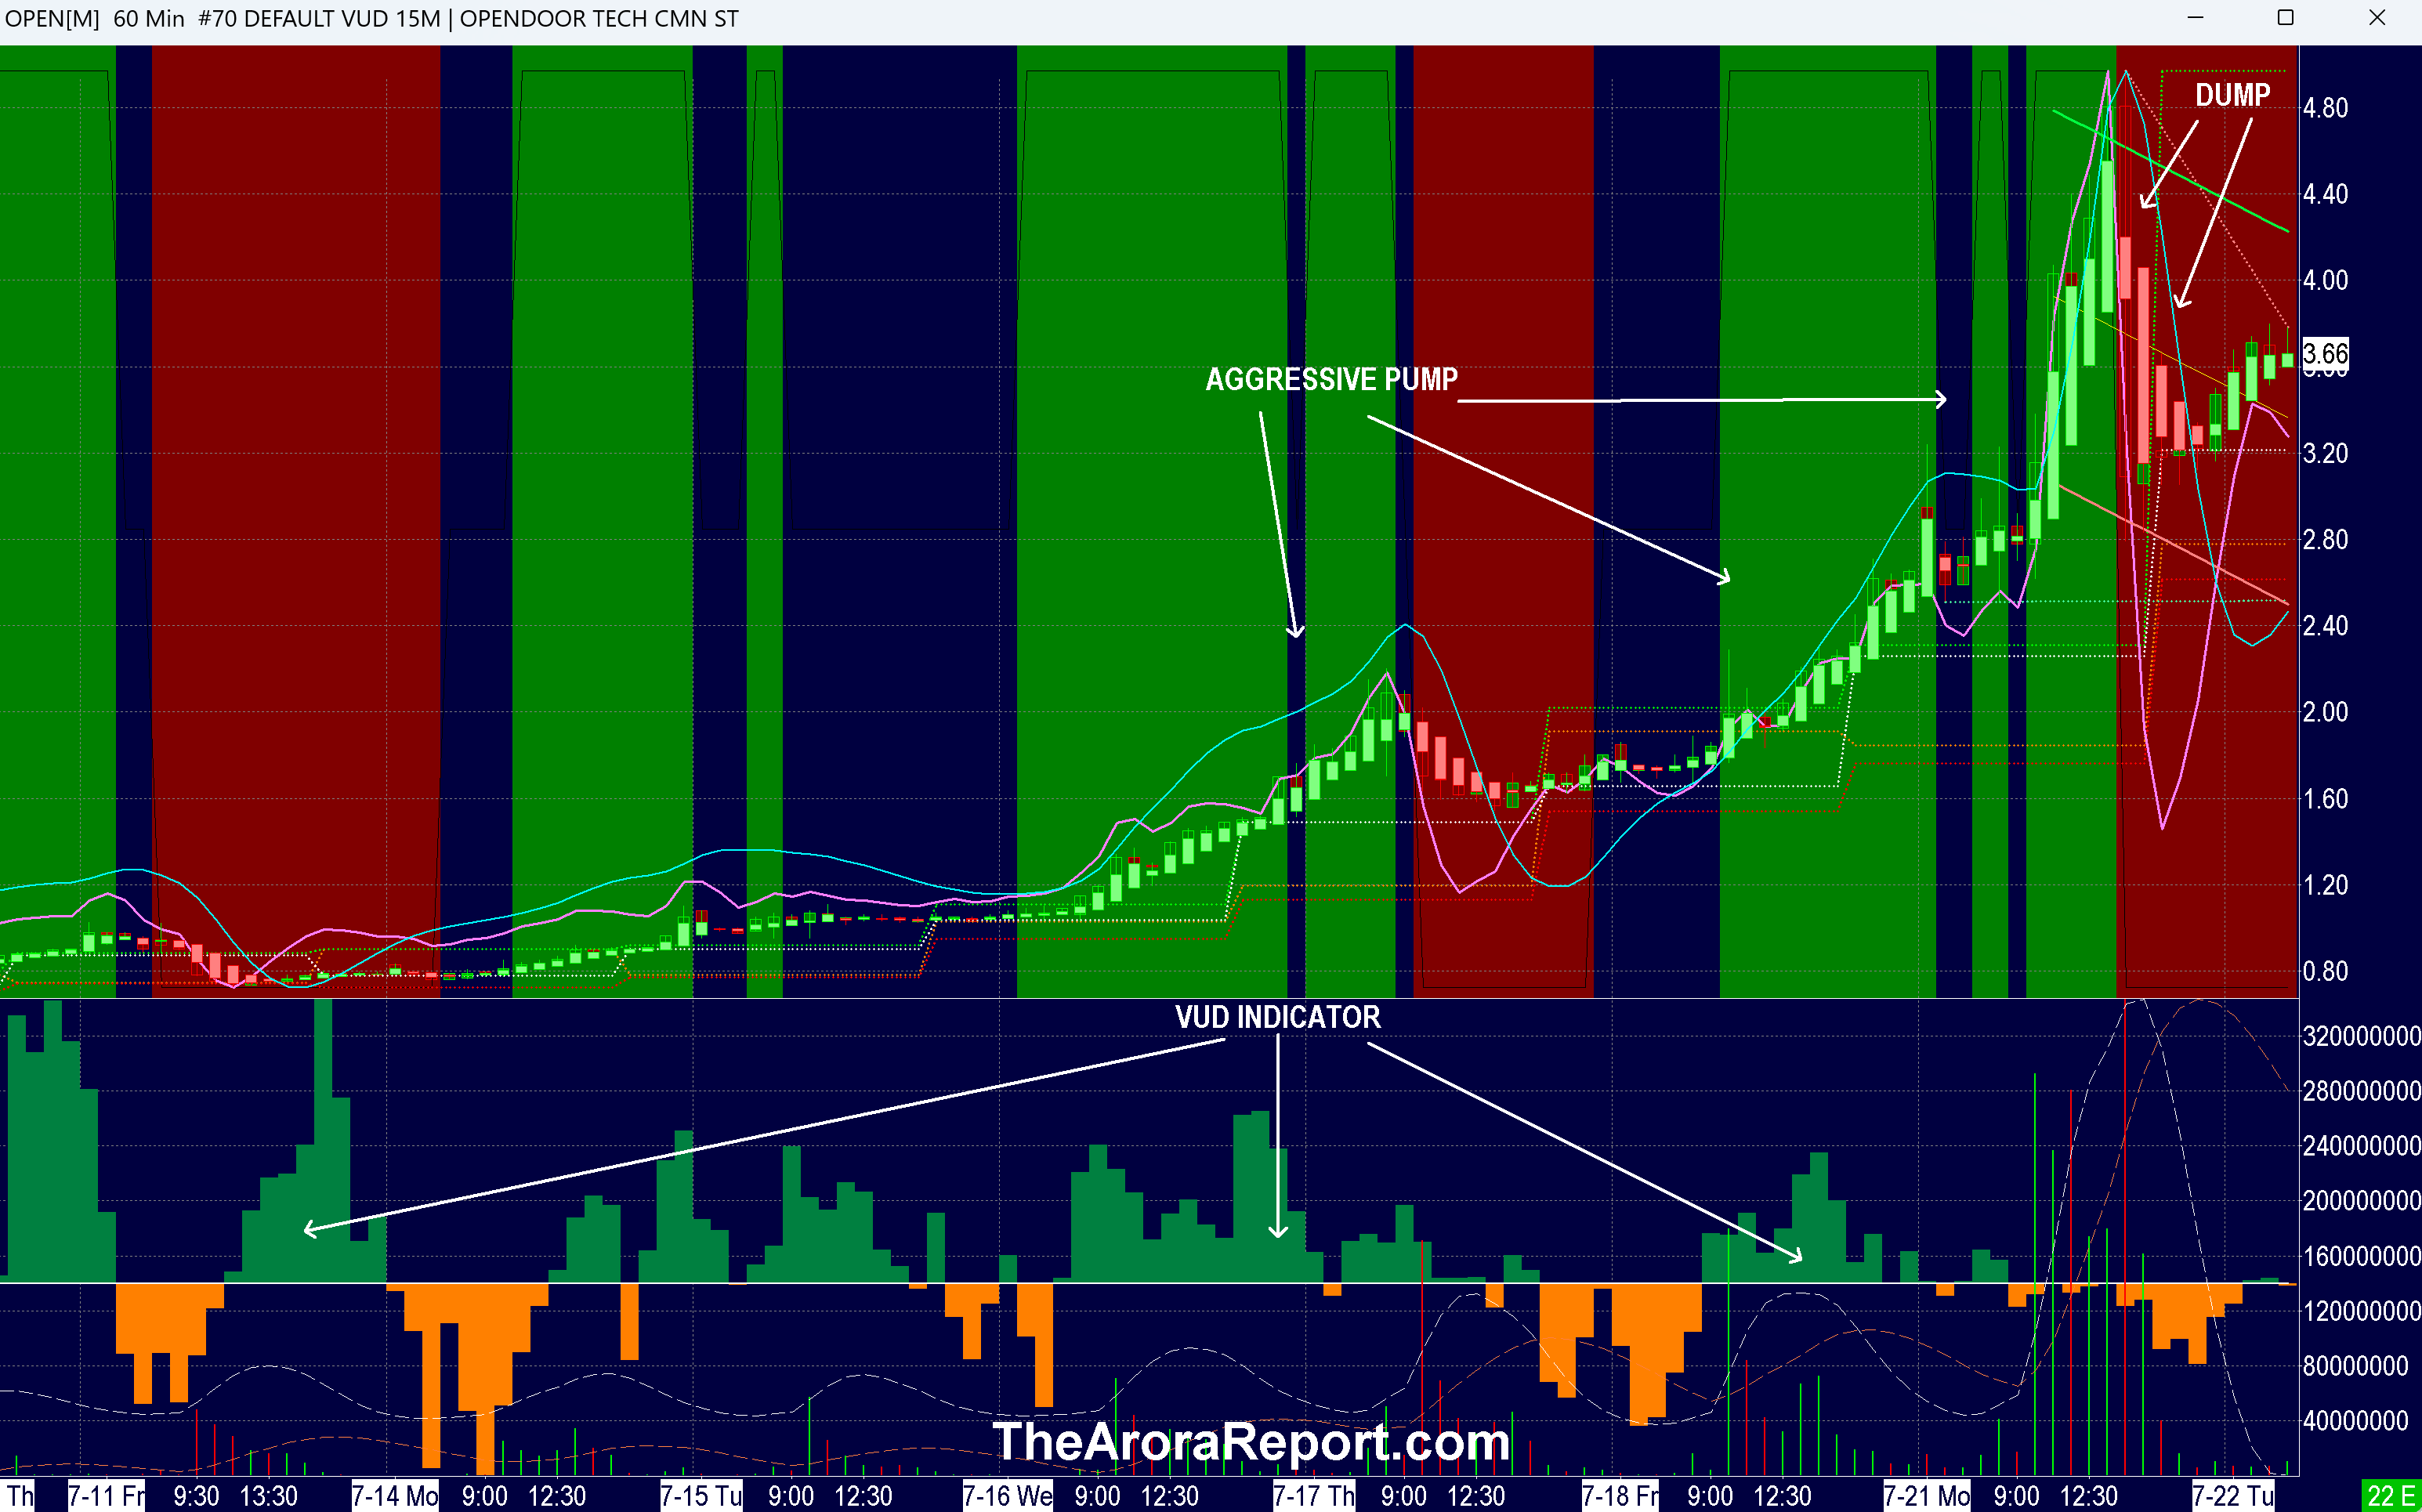
Please click here for a chart of Opendoor Technologies Inc (NASDAQ:OPEN).
Note the following:
- This article is about the big picture, not an individual stock. The chart of OPEN stock is being used to illustrate the point.
- The chart shows an aggressive move up in OPEN stock.
- The move up was not due to a fundamental development or hard news, but due to aggressive pumping in the media.
- OPEN operates a digital platform for residential real estate transactions. Nothing changed in its business as the stock made the massive move up.
- The volume was massive, and it has been increasing rapidly. Yesterday, the volume was 1.82B shares; as a reference, the average volume is 137,000 shares. More importantly, the float is only 655.06M shares. Typically, only a very small fraction of the float trades every day. In the case of OPEN, the trading volume was about three times the float.
- The chart shows that in the afternoon, the stock quickly lost about half of its value before recovering. The reason for the drop appears to be a large seller quickly dumping the shares. The VUD indicator shows the net supply of stock at the time of the dump. VUD indicator is our powerful proprietary indicator that measures net supply and net demand in real time. Green on the chart indicates net demand, and orange on the chart indicates net supply.
- The momo crowd’s primary reason to buy a stock is that the stock is running up. The momo crowd's analysis is often limited to acting on pumps in the media.
- In our analysis, what has changed over the last week is that the momo crowd has become more reckless than ever, and pumpers have become more aggressive. OPEN is just one of the many examples. The increasingly reckless behavior of the momo crowd has triggered a yellow flag. This is not a precise timing signal but historically precedes a pullback.
- Other cracks are beginning to appear. The $500B Stargate project for AI, highly publicized by President Trump, is having difficulties getting off the ground.
- Treasury Secretary Bessent wants to review the "entire Federal Reserve Institution."
- Fed Chair Powell will be speaking today, and investors are awaiting clues about the policy and if he talks about his future.
- The momo crowd has been aggressively buying stocks, ignoring tariffs. Now, tariffs are beginning to show up in earnings. General Motors Co.’s (GM) profits were impacted as the tariffs cost General Motors $1.1B. For 2025, GM expects the impact of tariffs to be $4-5B. As is the pattern, the momo crowd will continue to remain oblivious to the hard data, but how long will non-momo investors ignore the hard data?
Magnificent Seven Money Flows
In the early trade, money flows are positive in Apple Inc (AAPL), Amazon.com, Inc. (AMZN), Alphabet Inc Class C (GOOG), Meta Platforms Inc (META), and Tesla Inc (TSLA).
In the early trade, money flows are neutral in Microsoft Corp (MSFT).
In the early trade, money flows are negative in NVIDIA Corp (NVDA).
In the early trade, money flows are neutral in SPDR S&P 500 ETF Trust (SPY) and Invesco QQQ Trust Series 1 (QQQ).
Momo Crowd And Smart Money In Stocks
Investors can gain an edge by knowing money flows in SPY and QQQ. Investors can get a bigger edge by knowing when smart money is buying stocks, gold, and oil. The most popular ETF for gold is SPDR Gold Trust (GLD). The most popular ETF for silver is iShares Silver Trust (SLV). The most popular ETF for oil is United States Oil ETF (USO).
Bitcoin
Previously, JPMorgan (JPM) had called bitcoin Bitcoin a fraud. Now, JPMorgan is looking at lending against cryptos. The perception of cryptos has quickly changed.
Bitcoin is range bound.
Arora Protection Band And What To Do Now
It is important for investors to look ahead and not in the rearview mirror. Our proprietary Protection Band puts all of the data, all of the indicators, all of the news, all of the crosscurrents, all of the models, and all of the analysis in an analytical framework that is easily actionable by investors.
Consider continuing to hold good, very long term, existing positions. Based on individual risk preference, consider a protection band consisting of cash or Treasury bills or short-term tactical trades as well as short to medium term hedges and short term hedges. This is a good way to protect yourself and participate in the upside at the same time.
You can determine your protection bands by adding cash to hedges. The high band of the protection is appropriate for those who are older or conservative. The low band of the protection is appropriate for those who are younger or aggressive. If you do not hedge, the total cash level should be more than stated above but significantly less than cash plus hedges.
A protection band of 0% would be very bullish and would indicate full investment with 0% in cash. A protection band of 100% would be very bearish and would indicate a need for aggressive protection with cash and hedges or aggressive short selling.
It is worth reminding that you cannot take advantage of new upcoming opportunities if you are not holding enough cash. When adjusting hedge levels, consider adjusting partial stop quantities for stock positions (non ETF); consider using wider stops on remaining quantities and also allowing more room for high beta stocks. High beta stocks are the ones that move more than the market.
Traditional 60/40 Portfolio
Probability based risk reward adjusted for inflation does not favor long duration strategic bond allocation at this time.
Those who want to stick to traditional 60% allocation to stocks and 40% to bonds may consider focusing on only high quality bonds and bonds of five year duration or less. Those willing to bring sophistication to their investing may consider using bond ETFs as tactical positions and not strategic positions at this time.
The Arora Report is known for its accurate calls. The Arora Report correctly called the big artificial intelligence rally before anyone else, the new bull market of 2023, the bear market of 2022, new stock market highs right after the virus low in 2020, the virus drop in 2020, the DJIA rally to 30,000 when it was trading at 16,000, the start of a mega bull market in 2009, and the financial crash of 2008. Please click here to sign up for a free forever Generate Wealth Newsletter.
Posted-In: contributors Expert IdeasMarket Summary Opinion Federal Reserve Markets Trading Ideas