Tech Stocks Trace A Negative Pattern; Figmazation Of Momo Crowd; Trump Weaponizes Tariffs
To gain an edge, this is what you need to know today.
Raise Cash And Hedges
it is time to raise hedges.
A Negative Pattern
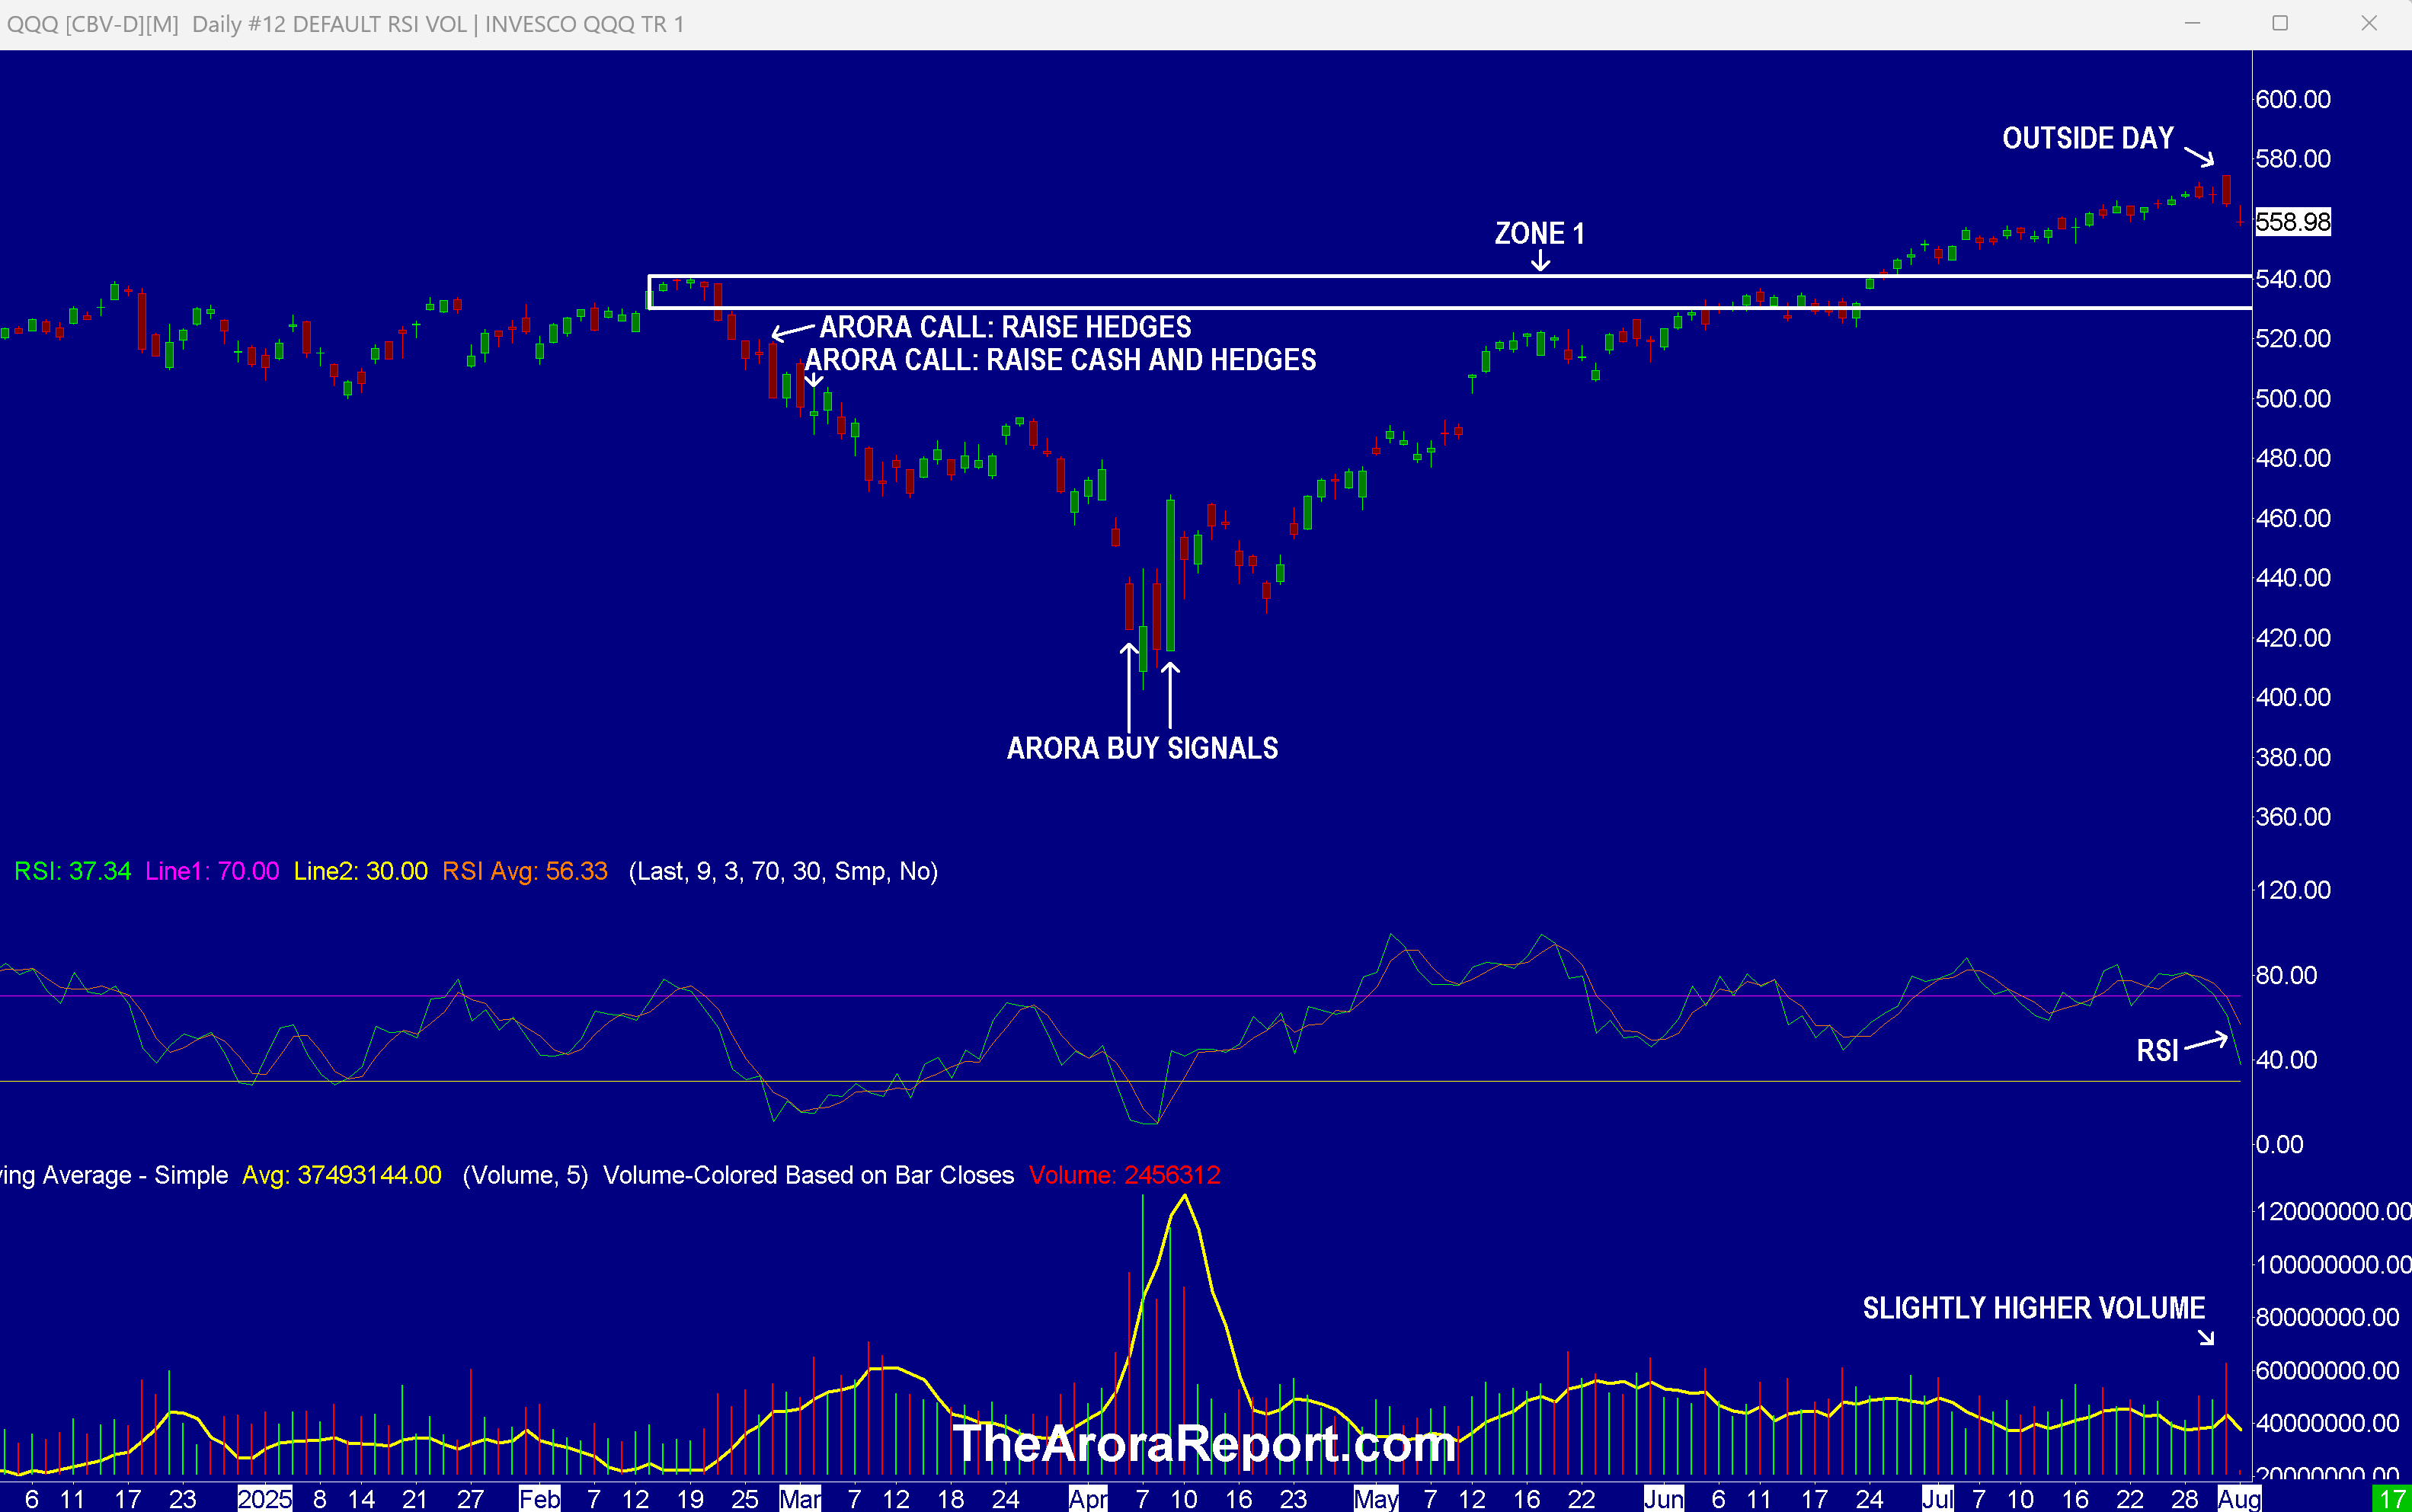
Please click here for an enlarged chart of Invesco QQQ Trust Series 1 (QQQ).
Note the following:
- The chart shows a prolonged run.
- The chart shows an outside day after the prolonged run. This is a negative pattern.
- The chart shows slightly higher volume. This is quasi-confirmation of the negative pattern. A heavier volume would have been better confirmation.
- RSI shown on the chart is approaching the oversold level. This indicates there could be a bounce.
- The chart shows the major support level at zone 1.
- The chart shows that QQQ is levitating considerably above the major support zone. This illustrates the risk. Smart money pays attention to both risk and reward. In contrast, the momo crowd has stars in their eyes and ignores risk.
- Figma Ord Shs (FIG) is a new IPO that was priced at $33. It has traded as high as $147.87 as of this writing in the premarket. No, Figma did not cure cancer; Figma is a cloud based platform where teams design, prototypes, and collaborate on digital products in real time. FIG stock is now valued at over 70 times sales (not earnings). Buying is coming mostly from the momo crowd. Figmazation of the momo crowd should ring alarm bells for investors as it is indicating extreme exuberance. As we have been sharing with you, extreme positive sentiment is a contrary indicator. In plain English, it means caution. It is worth a reminder that sentiment is not a precise timing indicator.
- There is unease in the markets due to two actions from President Trump:
- President Trump has imposed sweeping tariffs on countries that have not yet reached a deal. The most notable are high tariffs of 39% on Switzerland and 35% on Canada.
- President Trump is making it clear that tariffs are not only about economics. Countries must toe President Trump's geopolitical line lock, stop, and barrel or be met with harsh treatment.
- Tariffs on Taiwan are raising concern that President Trump will not support Taiwan in the event of a Chinese invasion.
- Tariffs on India are raising a concern that President Trump is walking away from an alliance with the world's largest democracy to counter China. Further, President Trump is weaponizing Pakistan, India's archrival and close ally of China, against India.
- The foregoing has serious negative implications in the long term for prudent investors in the U.S. markets.
- Prudent investors should note the long term negative implications for investors of the only country exempt from President Trump's harsh treatment with tariffs is China. China is the main strategic rival of the U.S. During his campaign and up until about two months ago, the main target of President Trump's fire was China. In our analysis, this was highly justified and badly needed because of the massive transfer of wealth from the U.S. to China over the last 25 years. However, China has turned the tables as China has the U.S. over a barrel on rare earth minerals.
- The jobs report was weak. The weak jobs report is adding fuel to President Trump's attacks on Fed Chair Powell. Here are the details:
- Non-farm payrolls came at 73K vs. 102K consensus.
- Non-farm private payrolls came at 83K vs. 110K consensus.
- Unemployment rate came at 4.2%% vs. 4.2% consensus.
- Average work week came at 34.3 vs. 34.2 consensus.
- Average hourly earnings came at 0.3% vs. 0.3% consensus.
- In addition to the current data, there are big downward revisions to the data for the last two months. Prudent investors should pay attention that the economic data appears to be less accurate now and more prone to revisions due to staff cuts in the U.S. government. If the accuracy of that data continues to worsen, it will make the markets more volatile.
- Expect blind money to flow into the stock market today. Blind money is the money that flows into the stock market on the first two days of the month without any analysis irrespective of market conditions.
- ISM Manufacturing Index and University of Michigan Consumer Sentiment was released at 10am ET today.
Magnificent Seven Money Flows
In the early trade, money flows are positive in Apple Inc (AAPL).
In the early trade, money flows are neutral in Microsoft Corp (MSFT).
In the early trade, money flows are negative in Amazon.com, Inc. (AMZN), Alphabet Inc Class C (GOOG), Meta Platforms Inc (META), NVIDIA Corp (NVDA), and Tesla Inc (TSLA).
In the early trade, money flows are negative in SPDR S&P 500 ETF Trust (SPY) and Nasdaq 100 ETF (QQQ).
Momo Crowd And Smart Money In Stocks
Investors can gain an edge by knowing money flows in SPY and QQQ. Investors can get a bigger edge by knowing when smart money is buying stocks, gold, and oil. The most popular ETF for gold is SPDR Gold Trust (GLD). The most popular ETF for silver is iShares Silver Trust (SLV). The most popular ETF for oil is United States Oil ETF (USO).
Bitcoin
Bitcoin is range bound.
What To Do Now
Consider continuing to hold good, very long term, existing positions. Based on individual risk preference, consider a protection band consisting of cash or Treasury bills or short-term tactical trades as well as short to medium term hedges and short term hedges. This is a good way to protect yourself and participate in the upside at the same time.
You can determine your protection bands by adding cash to hedges. The high band of the protection is appropriate for those who are older or conservative. The low band of the protection is appropriate for those who are younger or aggressive. If you do not hedge, the total cash level should be more than stated above but significantly less than cash plus hedges.
A protection band of 0% would be very bullish and would indicate full investment with 0% in cash. A protection band of 100% would be very bearish and would indicate a need for aggressive protection with cash and hedges or aggressive short selling.
It is worth reminding that you cannot take advantage of new upcoming opportunities if you are not holding enough cash. When adjusting hedge levels, consider adjusting partial stop quantities for stock positions (non ETF); consider using wider stops on remaining quantities and also allowing more room for high beta stocks. High beta stocks are the ones that move more than the market.
Traditional 60/40 Portfolio
Probability based risk reward adjusted for inflation does not favor long duration strategic bond allocation at this time.
Those who want to stick to traditional 60% allocation to stocks and 40% to bonds may consider focusing on only high quality bonds and bonds of five year duration or less. Those willing to bring sophistication to their investing may consider using bond ETFs as tactical positions and not strategic positions at this time.
Benzinga Disclaimer: This article is from an unpaid external contributor. It does not represent Benzinga’s reporting and has not been edited for content or accuracy.
Posted-In: contributors Expert IdeasMarket Summary Opinion Markets Trading Ideas