Deep Dive Into ITT Stock: Analyst Perspectives (8 Ratings)

In the preceding three months, 8 analysts have released ratings for ITT (NYSE:ITT), presenting a wide array of perspectives from bullish to bearish.
The table below summarizes their recent ratings, showcasing the evolving sentiments within the past 30 days and comparing them to the preceding months.
| Bullish | Somewhat Bullish | Indifferent | Somewhat Bearish | Bearish | |
|---|---|---|---|---|---|
| Total Ratings | 6 | 2 | 0 | 0 | 0 |
| Last 30D | 1 | 0 | 0 | 0 | 0 |
| 1M Ago | 3 | 1 | 0 | 0 | 0 |
| 2M Ago | 2 | 1 | 0 | 0 | 0 |
| 3M Ago | 0 | 0 | 0 | 0 | 0 |
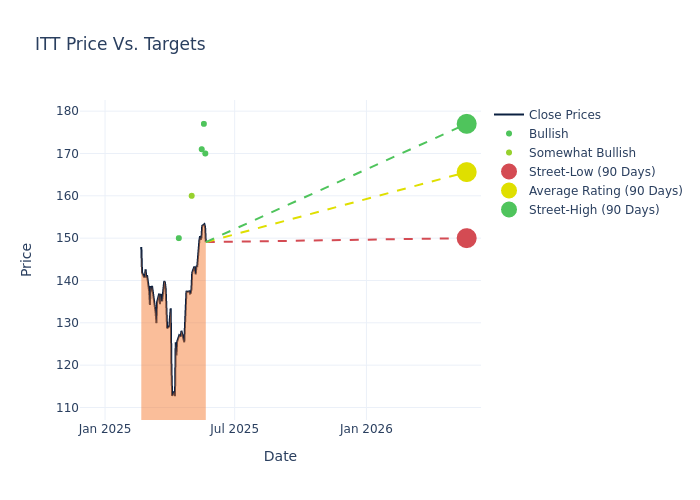
Analysts provide deeper insights through their assessments of 12-month price targets, revealing an average target of $160.88, a high estimate of $177.00, and a low estimate of $148.00. Highlighting a 0.54% decrease, the current average has fallen from the previous average price target of $161.75.
Decoding Analyst Ratings: A Detailed Look
The standing of ITT among financial experts becomes clear with a thorough analysis of recent analyst actions. The summary below outlines key analysts, their recent evaluations, and adjustments to ratings and price targets.
| Analyst | Analyst Firm | Action Taken | Rating | Current Price Target | Prior Price Target |
|---|---|---|---|---|---|
| Andrew Obin | B of A Securities | Raises | Buy | $170.00 | $145.00 |
| Joe Ritchie | Goldman Sachs | Raises | Buy | $177.00 | $160.00 |
| Nathan Jones | Stifel | Raises | Buy | $171.00 | $161.00 |
| Jeffrey Hammond | Keybanc | Raises | Overweight | $160.00 | $150.00 |
| Nathan Jones | Stifel | Raises | Buy | $161.00 | $148.00 |
| Vladimir Bystricky | Citigroup | Lowers | Buy | $150.00 | $181.00 |
| Nathan Jones | Stifel | Lowers | Buy | $148.00 | $179.00 |
| Jeffrey Hammond | Keybanc | Lowers | Overweight | $150.00 | $170.00 |
Key Insights:
- Action Taken: Analysts adapt their recommendations to changing market conditions and company performance. Whether they 'Maintain', 'Raise' or 'Lower' their stance, it reflects their response to recent developments related to ITT. This information provides a snapshot of how analysts perceive the current state of the company.
- Rating: Unveiling insights, analysts deliver qualitative insights into stock performance, from 'Outperform' to 'Underperform'. These ratings convey expectations for the relative performance of ITT compared to the broader market.
- Price Targets: Analysts gauge the dynamics of price targets, providing estimates for the future value of ITT's stock. This comparison reveals trends in analysts' expectations over time.
To gain a panoramic view of ITT's market performance, explore these analyst evaluations alongside essential financial indicators. Stay informed and make judicious decisions using our Ratings Table.
Stay up to date on ITT analyst ratings.
Discovering ITT: A Closer Look
ITT began its journey as International Telephone & Telegraph in 1920. Through decades of acquisitions in the mid-1900s, ITT went from manufacturing telephone switching equipment to operating hotels, car rentals, insurance agencies, and bread bakeries. In 1995, the firm split into three separate entities, one of which is the ITT in current operation. After a few more spinoffs in 2011, today ITT Inc. sells automotive, industrial, and aerospace products such as brake pads, seals, pumps, valves, connectors, and regulators. It has operations around the globe with notable exposures to North America, Europe, and Asia.
Key Indicators: ITT's Financial Health
Market Capitalization Analysis: Below industry benchmarks, the company's market capitalization reflects a smaller scale relative to peers. This could be attributed to factors such as growth expectations or operational capacity.
Revenue Growth: ITT's revenue growth over a period of 3M has been noteworthy. As of 31 March, 2025, the company achieved a revenue growth rate of approximately 0.26%. This indicates a substantial increase in the company's top-line earnings. As compared to its peers, the revenue growth lags behind its industry peers. The company achieved a growth rate lower than the average among peers in Industrials sector.
Net Margin: ITT's net margin surpasses industry standards, highlighting the company's exceptional financial performance. With an impressive 11.87% net margin, the company effectively manages costs and achieves strong profitability.
Return on Equity (ROE): ITT's ROE falls below industry averages, indicating challenges in efficiently using equity capital. With an ROE of 3.91%, the company may face hurdles in generating optimal returns for shareholders.
Return on Assets (ROA): ITT's ROA stands out, surpassing industry averages. With an impressive ROA of 2.27%, the company demonstrates effective utilization of assets and strong financial performance.
Debt Management: ITT's debt-to-equity ratio is below industry norms, indicating a sound financial structure with a ratio of 0.3.
How Are Analyst Ratings Determined?
Analysts work in banking and financial systems and typically specialize in reporting for stocks or defined sectors. Analysts may attend company conference calls and meetings, research company financial statements, and communicate with insiders to publish "analyst ratings" for stocks. Analysts typically rate each stock once per quarter.
Analysts may supplement their ratings with predictions for metrics like growth estimates, earnings, and revenue, offering investors a more comprehensive outlook. However, investors should be mindful that analysts, like any human, can have subjective perspectives influencing their forecasts.
Which Stocks Are Analysts Recommending Now?
Benzinga Edge gives you instant access to all major analyst upgrades, downgrades, and price targets. Sort by accuracy, upside potential, and more. Click here to stay ahead of the market.
This article was generated by Benzinga's automated content engine and reviewed by an editor.
Latest Ratings for ITT
| Date | Firm | Action | From | To |
|---|---|---|---|---|
| Dec 2021 | B of A Securities | Upgrades | Neutral | Buy |
| Aug 2021 | Oppenheimer | Maintains | Outperform | |
| Aug 2021 | Keybanc | Maintains | Overweight |
Posted-In: BZI-AARAnalyst Ratings