7 Analysts Have This To Say About Interactive Brokers Group

Throughout the last three months, 7 analysts have evaluated Interactive Brokers Group (NASDAQ:IBKR), offering a diverse set of opinions from bullish to bearish.
The following table encapsulates their recent ratings, offering a glimpse into the evolving sentiments over the past 30 days and comparing them to the preceding months.
| Bullish | Somewhat Bullish | Indifferent | Somewhat Bearish | Bearish | |
|---|---|---|---|---|---|
| Total Ratings | 3 | 3 | 1 | 0 | 0 |
| Last 30D | 0 | 1 | 0 | 0 | 0 |
| 1M Ago | 1 | 2 | 0 | 0 | 0 |
| 2M Ago | 0 | 0 | 1 | 0 | 0 |
| 3M Ago | 2 | 0 | 0 | 0 | 0 |
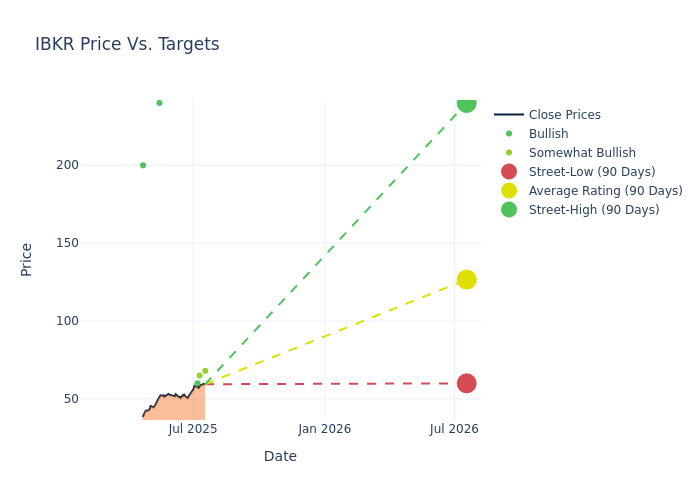
Analysts provide deeper insights through their assessments of 12-month price targets, revealing an average target of $130.43, a high estimate of $240.00, and a low estimate of $60.00. Experiencing a 3.54% decline, the current average is now lower than the previous average price target of $135.21.
Breaking Down Analyst Ratings: A Detailed Examination
A comprehensive examination of how financial experts perceive Interactive Brokers Group is derived from recent analyst actions. The following is a detailed summary of key analysts, their recent evaluations, and adjustments to ratings and price targets.
| Analyst | Analyst Firm | Action Taken | Rating | Current Price Target | Prior Price Target |
|---|---|---|---|---|---|
| Patrick Moley | Piper Sandler | Raises | Overweight | $68.00 | $65.00 |
| Patrick Moley | Piper Sandler | Raises | Overweight | $65.00 | $45.50 |
| Benjamin Budish | Barclays | Adjusts | Overweight | $65.00 | - |
| Christopher Allen | Citigroup | Raises | Buy | $60.00 | $53.75 |
| Christopher Allen | Citigroup | Raises | Neutral | $215.00 | $205.00 |
| James Yaro | Goldman Sachs | Raises | Buy | $240.00 | $212.00 |
| Brennan Hawken | UBS | Lowers | Buy | $200.00 | $230.00 |
Key Insights:
- Action Taken: Analysts respond to changes in market conditions and company performance, frequently updating their recommendations. Whether they 'Maintain', 'Raise' or 'Lower' their stance, it reflects their reaction to recent developments related to Interactive Brokers Group. This information offers a snapshot of how analysts perceive the current state of the company.
- Rating: Gaining insights, analysts provide qualitative assessments, ranging from 'Outperform' to 'Underperform'. These ratings reflect expectations for the relative performance of Interactive Brokers Group compared to the broader market.
- Price Targets: Gaining insights, analysts provide estimates for the future value of Interactive Brokers Group's stock. This comparison reveals trends in analysts' expectations over time.
Considering these analyst evaluations in conjunction with other financial indicators can offer a comprehensive understanding of Interactive Brokers Group's market position. Stay informed and make well-informed decisions with our Ratings Table.
Stay up to date on Interactive Brokers Group analyst ratings.
Discovering Interactive Brokers Group: A Closer Look
Interactive Brokers is a large, automated, retail and institutional brokerage that boasted nearly $570 billion in customer equity at the end of 2024. The company cut its teeth as a market maker, introducing US financial markets to automated and algorithmic training before expanding into brokerage services in 1993. The firm has a wide-ranging client base, with its best-in-class order execution and extremely low margin lending rates catering to a sophisticated audience of hedge funds, proprietary traders, and introducing brokers that account for about 45% of the firm's commissions. With operations spanning more than 160 electronic exchanges, 36 countries, and 28 currencies, Interactive Brokers caters to a global clientele, with more than 80% of active accounts sitting outside the US market.
Interactive Brokers Group: A Financial Overview
Market Capitalization Perspectives: The company's market capitalization falls below industry averages, signaling a relatively smaller size compared to peers. This positioning may be influenced by factors such as perceived growth potential or operational scale.
Revenue Growth: Interactive Brokers Group's revenue growth over a period of 3M has been noteworthy. As of 31 March, 2025, the company achieved a revenue growth rate of approximately 5.1%. This indicates a substantial increase in the company's top-line earnings. As compared to its peers, the revenue growth lags behind its industry peers. The company achieved a growth rate lower than the average among peers in Financials sector.
Net Margin: Interactive Brokers Group's net margin lags behind industry averages, suggesting challenges in maintaining strong profitability. With a net margin of 9.22%, the company may face hurdles in effective cost management.
Return on Equity (ROE): The company's ROE is below industry benchmarks, signaling potential difficulties in efficiently using equity capital. With an ROE of 4.85%, the company may need to address challenges in generating satisfactory returns for shareholders.
Return on Assets (ROA): Interactive Brokers Group's ROA is below industry averages, indicating potential challenges in efficiently utilizing assets. With an ROA of 0.14%, the company may face hurdles in achieving optimal financial returns.
Debt Management: The company maintains a balanced debt approach with a debt-to-equity ratio below industry norms, standing at 0.0.
The Basics of Analyst Ratings
Experts in banking and financial systems, analysts specialize in reporting for specific stocks or defined sectors. Their comprehensive research involves attending company conference calls and meetings, analyzing financial statements, and engaging with insiders to generate what are known as analyst ratings for stocks. Typically, analysts assess and rate each stock once per quarter.
Some analysts publish their predictions for metrics such as growth estimates, earnings, and revenue to provide additional guidance with their ratings. When using analyst ratings, it is important to keep in mind that stock and sector analysts are also human and are only offering their opinions to investors.
If you want to keep track of which analysts are outperforming others, you can view updated analyst ratings along withanalyst success scores in Benzinga Pro.
Breaking: Wall Street's Next Big Mover
Benzinga's #1 analyst just identified a stock poised for explosive growth. This under-the-radar company could surge 200%+ as major market shifts unfold. Click here for urgent details.
This article was generated by Benzinga's automated content engine and reviewed by an editor.
Latest Ratings for IBKR
| Date | Firm | Action | From | To |
|---|---|---|---|---|
| Jan 2022 | Keefe, Bruyette & Woods | Upgrades | Market Perform | Outperform |
| Jan 2022 | Goldman Sachs | Maintains | Neutral | |
| Dec 2021 | B of A Securities | Initiates Coverage On | Buy |
Posted-In: BZI-AARAnalyst Ratings