What Analysts Are Saying About Newmont Stock
4 analysts have expressed a variety of opinions on Newmont (NYSE:NEM) over the past quarter, offering a diverse set of opinions from bullish to bearish.
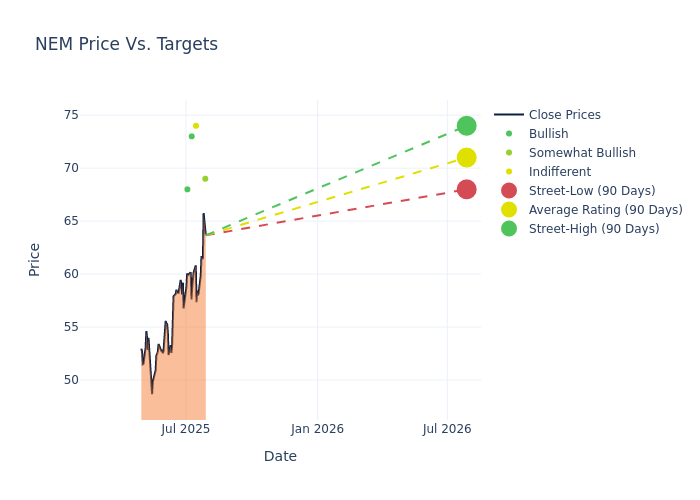
In the table below, you'll find a summary of their recent ratings, revealing the shifting sentiments over the past 30 days and comparing them to the previous months.
| Bullish | Somewhat Bullish | Indifferent | Somewhat Bearish | Bearish | |
|---|---|---|---|---|---|
| Total Ratings | 2 | 1 | 1 | 0 | 0 |
| Last 30D | 0 | 1 | 0 | 0 | 0 |
| 1M Ago | 2 | 0 | 1 | 0 | 0 |
| 2M Ago | 0 | 0 | 0 | 0 | 0 |
| 3M Ago | 0 | 0 | 0 | 0 | 0 |
Analysts have set 12-month price targets for Newmont, revealing an average target of $71.0, a high estimate of $74.00, and a low estimate of $68.00. Observing a 13.91% increase, the current average has risen from the previous average price target of $62.33.
Interpreting Analyst Ratings: A Closer Look
The analysis of recent analyst actions sheds light on the perception of Newmont by financial experts. The following summary presents key analysts, their recent evaluations, and adjustments to ratings and price targets.
| Analyst | Analyst Firm | Action Taken | Rating | Current Price Target | Prior Price Target |
|---|---|---|---|---|---|
| Brian MacArthur | Raymond James | Raises | Outperform | $69.00 | $67.00 |
| Anita Soni | CIBC | Raises | Neutral | $74.00 | $60.00 |
| Ralph Profiti | Stifel | Announces | Buy | $73.00 | - |
| Daniel Major | UBS | Raises | Buy | $68.00 | $60.00 |
Key Insights:
- Action Taken: Responding to changing market dynamics and company performance, analysts update their recommendations. Whether they 'Maintain', 'Raise', or 'Lower' their stance, it signifies their response to recent developments related to Newmont. This offers insight into analysts' perspectives on the current state of the company.
- Rating: Unveiling insights, analysts deliver qualitative insights into stock performance, from 'Outperform' to 'Underperform'. These ratings convey expectations for the relative performance of Newmont compared to the broader market.
- Price Targets: Analysts gauge the dynamics of price targets, providing estimates for the future value of Newmont's stock. This comparison reveals trends in analysts' expectations over time.
Assessing these analyst evaluations alongside crucial financial indicators can provide a comprehensive overview of Newmont's market position. Stay informed and make well-judged decisions with the assistance of our Ratings Table.
Stay up to date on Newmont analyst ratings.
Unveiling the Story Behind Newmont
Newmont is the world's largest gold miner. It bought Goldcorp in 2019, combined its Nevada mines in a joint venture with competitor Barrick later that year, and also purchased competitor Newcrest in November 2023. Its portfolio includes 17 wholly or majority owned mines and interests in two joint ventures in the Americas, Africa, Australia and Papua New Guinea. The company is expected to sell roughly 5.6 million ounces of gold in 2025 from its core mines after selling six higher-cost, smaller mines. Newmont also produces material amounts of copper, silver, zinc, and lead as byproducts. It had about two decades of gold reserves along with significant byproduct reserves at the end of December 2024.
Understanding the Numbers: Newmont's Finances
Market Capitalization Analysis: Above industry benchmarks, the company's market capitalization emphasizes a noteworthy size, indicative of a strong market presence.
Revenue Growth: Newmont displayed positive results in 3M. As of 30 June, 2025, the company achieved a solid revenue growth rate of approximately 20.79%. This indicates a notable increase in the company's top-line earnings. As compared to its peers, the revenue growth lags behind its industry peers. The company achieved a growth rate lower than the average among peers in Materials sector.
Net Margin: Newmont's financial strength is reflected in its exceptional net margin, which exceeds industry averages. With a remarkable net margin of 38.76%, the company showcases strong profitability and effective cost management.
Return on Equity (ROE): Newmont's ROE stands out, surpassing industry averages. With an impressive ROE of 6.51%, the company demonstrates effective use of equity capital and strong financial performance.
Return on Assets (ROA): The company's ROA is a standout performer, exceeding industry averages. With an impressive ROA of 3.72%, the company showcases effective utilization of assets.
Debt Management: Newmont's debt-to-equity ratio stands notably higher than the industry average, reaching 0.24. This indicates a heavier reliance on borrowed funds, raising concerns about financial leverage.
Analyst Ratings: Simplified
Ratings come from analysts, or specialists within banking and financial systems that report for specific stocks or defined sectors (typically once per quarter for each stock). Analysts usually derive their information from company conference calls and meetings, financial statements, and conversations with important insiders to reach their decisions.
Some analysts publish their predictions for metrics such as growth estimates, earnings, and revenue to provide additional guidance with their ratings. When using analyst ratings, it is important to keep in mind that stock and sector analysts are also human and are only offering their opinions to investors.
If you want to keep track of which analysts are outperforming others, you can view updated analyst ratings along withanalyst success scores in Benzinga Pro.
Which Stocks Are Analysts Recommending Now?
Benzinga Edge gives you instant access to all major analyst upgrades, downgrades, and price targets. Sort by accuracy, upside potential, and more. Click here to stay ahead of the market.
This article was generated by Benzinga's automated content engine and reviewed by an editor.
Latest Ratings for NEM
| Date | Firm | Action | From | To |
|---|---|---|---|---|
| Mar 2022 | Jefferies | Maintains | Hold | |
| Feb 2022 | Canaccord Genuity | Downgrades | Buy | Hold |
| Jan 2022 | Scotiabank | Downgrades | Sector Outperform | Sector Perform |
Posted-In: BZI-AARAnalyst Ratings