BXP Stock: A Deep Dive Into Analyst Perspectives (8 Ratings)
In the preceding three months, 8 analysts have released ratings for BXP (NYSE:BXP), presenting a wide array of perspectives from bullish to bearish.
The following table summarizes their recent ratings, shedding light on the changing sentiments within the past 30 days and comparing them to the preceding months.
| Bullish | Somewhat Bullish | Indifferent | Somewhat Bearish | Bearish | |
|---|---|---|---|---|---|
| Total Ratings | 0 | 4 | 4 | 0 | 0 |
| Last 30D | 0 | 1 | 0 | 0 | 0 |
| 1M Ago | 0 | 1 | 2 | 0 | 0 |
| 2M Ago | 0 | 1 | 1 | 0 | 0 |
| 3M Ago | 0 | 1 | 1 | 0 | 0 |
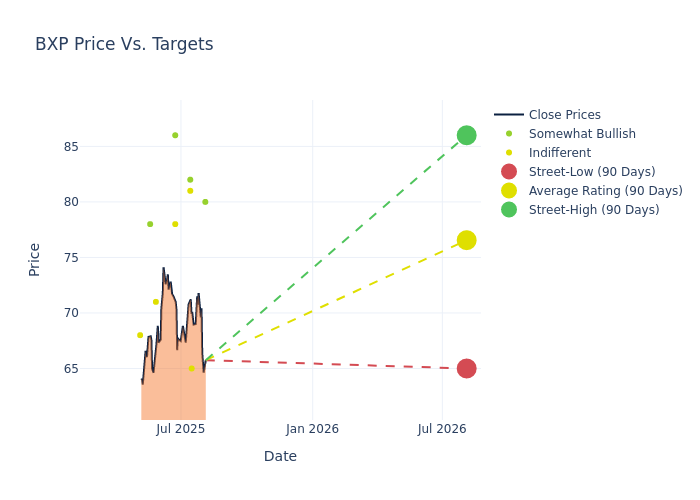
Providing deeper insights, analysts have established 12-month price targets, indicating an average target of $77.62, along with a high estimate of $86.00 and a low estimate of $65.00. Experiencing a 1.12% decline, the current average is now lower than the previous average price target of $78.50.
Diving into Analyst Ratings: An In-Depth Exploration
In examining recent analyst actions, we gain insights into how financial experts perceive BXP. The following summary outlines key analysts, their recent evaluations, and adjustments to ratings and price targets.
| Analyst | Analyst Firm | Action Taken | Rating | Current Price Target | Prior Price Target |
|---|---|---|---|---|---|
| Alexander Goldfarb | Piper Sandler | Lowers | Overweight | $80.00 | $85.00 |
| Ronald Josey | Morgan Stanley | Raises | Equal-Weight | $65.00 | $62.00 |
| Vikram Malhotra | Mizuho | Lowers | Outperform | $82.00 | $86.00 |
| Nicholas Yulico | Scotiabank | Lowers | Sector Perform | $81.00 | $83.00 |
| John Kim | BMO Capital | Raises | Outperform | $86.00 | $85.00 |
| Anthony Paolone | JP Morgan | Raises | Neutral | $78.00 | $72.00 |
| Michael Lewis | Truist Securities | Lowers | Hold | $71.00 | $75.00 |
| Blaine Heck | Wells Fargo | Lowers | Overweight | $78.00 | $80.00 |
Key Insights:
- Action Taken: Responding to changing market dynamics and company performance, analysts update their recommendations. Whether they 'Maintain', 'Raise', or 'Lower' their stance, it signifies their response to recent developments related to BXP. This offers insight into analysts' perspectives on the current state of the company.
- Rating: Analysts assign qualitative assessments to stocks, ranging from 'Outperform' to 'Underperform'. These ratings convey the analysts' expectations for the relative performance of BXP compared to the broader market.
- Price Targets: Analysts provide insights into price targets, offering estimates for the future value of BXP's stock. This comparison reveals trends in analysts' expectations over time.
For valuable insights into BXP's market performance, consider these analyst evaluations alongside crucial financial indicators. Stay well-informed and make prudent decisions using our Ratings Table.
Stay up to date on BXP analyst ratings.
Discovering BXP: A Closer Look
BXP Inc. owns over 180 properties consisting of approximately 53 million rentable square feet of space. The portfolio is dominated by office buildings and is spread across major cities such as New York, Boston, San Francisco, Los Angeles, Seattle, and the Washington, D.C., region. The real estate investment trust also owns limited retail, hotel, and residential properties.
BXP: Financial Performance Dissected
Market Capitalization: Positioned above industry average, the company's market capitalization underscores its superiority in size, indicative of a strong market presence.
Revenue Growth: BXP's remarkable performance in 3M is evident. As of 30 June, 2025, the company achieved an impressive revenue growth rate of 0.37%. This signifies a substantial increase in the company's top-line earnings. As compared to its peers, the company achieved a growth rate higher than the average among peers in Real Estate sector.
Net Margin: BXP's financial strength is reflected in its exceptional net margin, which exceeds industry averages. With a remarkable net margin of 10.25%, the company showcases strong profitability and effective cost management.
Return on Equity (ROE): BXP's ROE excels beyond industry benchmarks, reaching 1.68%. This signifies robust financial management and efficient use of shareholder equity capital.
Return on Assets (ROA): BXP's ROA surpasses industry standards, highlighting the company's exceptional financial performance. With an impressive 0.35% ROA, the company effectively utilizes its assets for optimal returns.
Debt Management: BXP's debt-to-equity ratio stands notably higher than the industry average, reaching 3.15. This indicates a heavier reliance on borrowed funds, raising concerns about financial leverage.
What Are Analyst Ratings?
Experts in banking and financial systems, analysts specialize in reporting for specific stocks or defined sectors. Their comprehensive research involves attending company conference calls and meetings, analyzing financial statements, and engaging with insiders to generate what are known as analyst ratings for stocks. Typically, analysts assess and rate each stock once per quarter.
Analysts may supplement their ratings with predictions for metrics like growth estimates, earnings, and revenue, offering investors a more comprehensive outlook. However, investors should be mindful that analysts, like any human, can have subjective perspectives influencing their forecasts.
Which Stocks Are Analysts Recommending Now?
Benzinga Edge gives you instant access to all major analyst upgrades, downgrades, and price targets. Sort by accuracy, upside potential, and more. Click here to stay ahead of the market.
This article was generated by Benzinga's automated content engine and reviewed by an editor.
Latest Ratings for BXP
| Date | Firm | Action | From | To |
|---|---|---|---|---|
| Mar 2022 | Evercore ISI Group | Downgrades | Outperform | In-Line |
| Jan 2022 | BMO Capital | Upgrades | Market Perform | Outperform |
| Jan 2022 | Deutsche Bank | Upgrades | Hold | Buy |
Posted-In: BZI-AARAnalyst Ratings