A Glimpse of RTX's Earnings Potential
RTX (NYSE:RTX) is preparing to release its quarterly earnings on Tuesday, 2025-07-22. Here's a brief overview of what investors should keep in mind before the announcement.
Analysts expect RTX to report an earnings per share (EPS) of $1.44.
The market awaits RTX's announcement, with hopes high for news of surpassing estimates and providing upbeat guidance for the next quarter.
It's important for new investors to understand that guidance can be a significant driver of stock prices.
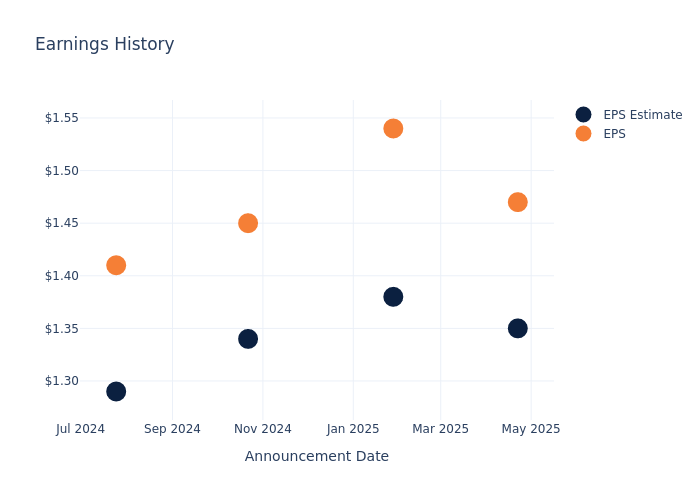
Historical Earnings Performance
In the previous earnings release, the company beat EPS by $0.12, leading to a 5.74% increase in the share price the following trading session.
Here's a look at RTX's past performance and the resulting price change:
| Quarter | Q1 2025 | Q4 2024 | Q3 2024 | Q2 2024 |
|---|---|---|---|---|
| EPS Estimate | 1.35 | 1.38 | 1.34 | 1.29 |
| EPS Actual | 1.47 | 1.54 | 1.45 | 1.41 |
| Price Change % | 6.0% | -3.0% | 1.0% | 0.0% |
Performance of RTX Shares
Shares of RTX were trading at $151.5 as of July 18. Over the last 52-week period, shares are up 45.47%. Given that these returns are generally positive, long-term shareholders are likely bullish going into this earnings release.
Insights Shared by Analysts on RTX
Understanding market sentiments and expectations within the industry is crucial for investors. This analysis delves into the latest insights on RTX.
The consensus rating for RTX is Outperform, based on 7 analyst ratings. With an average one-year price target of $148.0, there's a potential 2.31% downside.
Comparing Ratings with Competitors
The analysis below examines the analyst ratings and average 1-year price targets of GE Aerospace, Lockheed Martin and General Dynamics, three significant industry players, providing valuable insights into their relative performance expectations and market positioning.
- Analysts currently favor an Buy trajectory for GE Aerospace, with an average 1-year price target of $265.44, suggesting a potential 75.21% upside.
- Analysts currently favor an Neutral trajectory for Lockheed Martin, with an average 1-year price target of $518.25, suggesting a potential 242.08% upside.
- Analysts currently favor an Buy trajectory for General Dynamics, with an average 1-year price target of $309.83, suggesting a potential 104.51% upside.
Insights: Peer Analysis
The peer analysis summary presents essential metrics for GE Aerospace, Lockheed Martin and General Dynamics, unveiling their respective standings within the industry and providing valuable insights into their market positions and comparative performance.
| Company | Consensus | Revenue Growth | Gross Profit | Return on Equity |
|---|---|---|---|---|
| RTX | Outperform | 5.19% | $4.12B | 2.52% |
| GE Aerospace | Buy | 10.95% | $3.94B | 10.57% |
| Lockheed Martin | Neutral | 4.47% | $2.32B | 26.31% |
| General Dynamics | Buy | 13.90% | $1.89B | 4.49% |
Key Takeaway:
RTX ranks in the middle for revenue growth among its peers. It has the highest gross profit margin. RTX has the lowest return on equity compared to its peers.
All You Need to Know About RTX
RTX is an aerospace and defense manufacturer formed from the merger of United Technologies and Raytheon, with roughly equal exposure as a supplier to commercial aerospace and to the defense market across three segments: Collins Aerospace, a diversified aerospace supplier; Pratt & Whitney, a commercial and military aircraft engine manufacturer; and Raytheon, a defense prime contractor providing a mix of missiles, missile defense systems, sensors, hardware, and communications technology to the military.
RTX: Delving into Financials
Market Capitalization: Exceeding industry standards, the company's market capitalization places it above industry average in size relative to peers. This emphasizes its significant scale and robust market position.
Positive Revenue Trend: Examining RTX's financials over 3 months reveals a positive narrative. The company achieved a noteworthy revenue growth rate of 5.19% as of 31 March, 2025, showcasing a substantial increase in top-line earnings. As compared to its peers, the revenue growth lags behind its industry peers. The company achieved a growth rate lower than the average among peers in Industrials sector.
Net Margin: The company's net margin is a standout performer, exceeding industry averages. With an impressive net margin of 7.56%, the company showcases strong profitability and effective cost control.
Return on Equity (ROE): RTX's ROE falls below industry averages, indicating challenges in efficiently using equity capital. With an ROE of 2.52%, the company may face hurdles in generating optimal returns for shareholders.
Return on Assets (ROA): RTX's ROA is below industry averages, indicating potential challenges in efficiently utilizing assets. With an ROA of 0.94%, the company may face hurdles in achieving optimal financial returns.
Debt Management: RTX's debt-to-equity ratio is below industry norms, indicating a sound financial structure with a ratio of 0.7.
To track all earnings releases for RTX visit their earnings calendar on our site.
This article was generated by Benzinga's automated content engine and reviewed by an editor.