A Preview Of Baker Hughes's Earnings
Baker Hughes (NASDAQ:BKR) will release its quarterly earnings report on Tuesday, 2025-07-22. Here's a brief overview for investors ahead of the announcement.
Analysts anticipate Baker Hughes to report an earnings per share (EPS) of $0.55.
Baker Hughes bulls will hope to hear the company announce they've not only beaten that estimate, but also to provide positive guidance, or forecasted growth, for the next quarter.
New investors should note that it is sometimes not an earnings beat or miss that most affects the price of a stock, but the guidance (or forecast).
Overview of Past Earnings
In the previous earnings release, the company beat EPS by $0.03, leading to a 6.44% drop in the share price the following trading session.
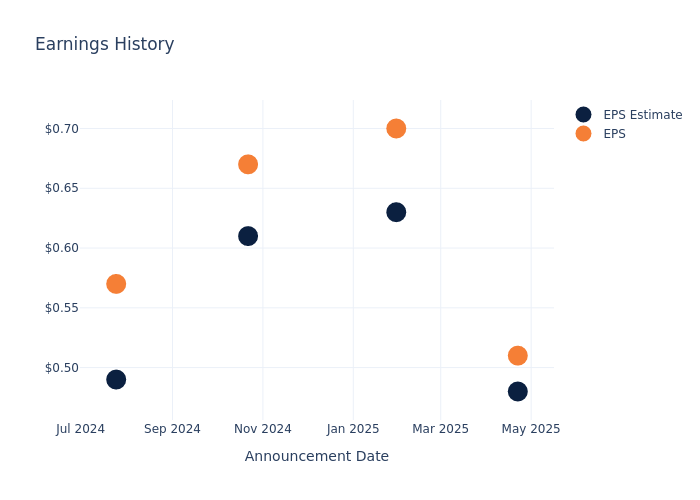
Here's a look at Baker Hughes's past performance and the resulting price change:
| Quarter | Q1 2025 | Q4 2024 | Q3 2024 | Q2 2024 |
|---|---|---|---|---|
| EPS Estimate | 0.48 | 0.63 | 0.61 | 0.49 |
| EPS Actual | 0.51 | 0.70 | 0.67 | 0.57 |
| Price Change % | -6.0% | 4.0% | 3.0% | 6.0% |
Stock Performance
Shares of Baker Hughes were trading at $39.72 as of July 18. Over the last 52-week period, shares are up 11.99%. Given that these returns are generally positive, long-term shareholders should be satisfied going into this earnings release.
Analysts' Take on Baker Hughes
For investors, staying informed about market sentiments and expectations in the industry is paramount. This analysis provides an exploration of the latest insights on Baker Hughes.
Baker Hughes has received a total of 11 ratings from analysts, with the consensus rating as Outperform. With an average one-year price target of $46.91, the consensus suggests a potential 18.1% upside.
Peer Ratings Comparison
In this analysis, we delve into the analyst ratings and average 1-year price targets of SLB, Halliburton and TechnipFMC, three key industry players, offering insights into their relative performance expectations and market positioning.
- Analysts currently favor an Outperform trajectory for SLB, with an average 1-year price target of $46.33, suggesting a potential 16.64% upside.
- Analysts currently favor an Buy trajectory for Halliburton, with an average 1-year price target of $27.27, suggesting a potential 31.34% downside.
- Analysts currently favor an Outperform trajectory for TechnipFMC, with an average 1-year price target of $40.75, suggesting a potential 2.59% upside.
Snapshot: Peer Analysis
In the peer analysis summary, key metrics for SLB, Halliburton and TechnipFMC are highlighted, providing an understanding of their respective standings within the industry and offering insights into their market positions and comparative performance.
| Company | Consensus | Revenue Growth | Gross Profit | Return on Equity |
|---|---|---|---|---|
| Baker Hughes | Outperform | 0.14% | $1.48B | 2.37% |
| SLB | Outperform | -2.49% | $1.61B | 3.92% |
| Halliburton | Buy | -6.67% | $879M | 1.95% |
| TechnipFMC | Outperform | 9.38% | $464.90M | 4.61% |
Key Takeaway:
Baker Hughes ranks at the bottom for Revenue Growth and Gross Profit, while it ranks in the middle for Return on Equity.
Get to Know Baker Hughes Better
Following a 2022 reorganization, Baker Hughes operates across two segments: oilfield services and equipment, and industrial and energy technology. The firm's oilfield services and equipment segment, or OFSE, is one of the Big Three oilfield service players, along with SLB and Halliburton, and mostly supplies to hydrocarbon developers and producers, including national oil companies, major integrated firms, and independents. Markets outside of North America buy roughly three quarters of the firm's OFSE. Baker Hughes' industrial and energy technology segment manufactures and sells turbines, compressors, pumps, valves, and related testing and monitoring services across various energy and industrial applications.
Baker Hughes's Economic Impact: An Analysis
Market Capitalization: Exceeding industry standards, the company's market capitalization places it above industry average in size relative to peers. This emphasizes its significant scale and robust market position.
Revenue Growth: Baker Hughes displayed positive results in 3 months. As of 31 March, 2025, the company achieved a solid revenue growth rate of approximately 0.14%. This indicates a notable increase in the company's top-line earnings. In comparison to its industry peers, the company trails behind with a growth rate lower than the average among peers in the Energy sector.
Net Margin: Baker Hughes's net margin is below industry standards, pointing towards difficulties in achieving strong profitability. With a net margin of 6.25%, the company may encounter challenges in effective cost control.
Return on Equity (ROE): Baker Hughes's ROE falls below industry averages, indicating challenges in efficiently using equity capital. With an ROE of 2.37%, the company may face hurdles in generating optimal returns for shareholders.
Return on Assets (ROA): Baker Hughes's ROA is below industry averages, indicating potential challenges in efficiently utilizing assets. With an ROA of 1.05%, the company may face hurdles in achieving optimal financial returns.
Debt Management: Baker Hughes's debt-to-equity ratio is below industry norms, indicating a sound financial structure with a ratio of 0.35.
To track all earnings releases for Baker Hughes visit their earnings calendar on our site.
This article was generated by Benzinga's automated content engine and reviewed by an editor.