IBM's Earnings Outlook
IBM (NYSE:IBM) is gearing up to announce its quarterly earnings on Wednesday, 2025-07-23. Here's a quick overview of what investors should know before the release.
Analysts are estimating that IBM will report an earnings per share (EPS) of $2.65.
IBM bulls will hope to hear the company announce they've not only beaten that estimate, but also to provide positive guidance, or forecasted growth, for the next quarter.
New investors should note that it is sometimes not an earnings beat or miss that most affects the price of a stock, but the guidance (or forecast).
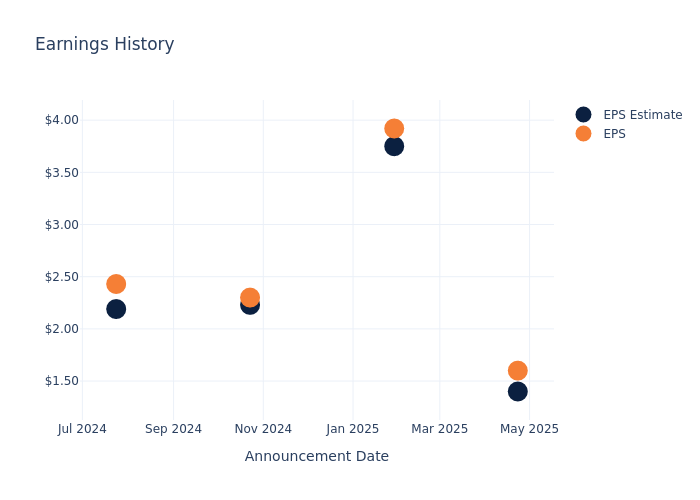
Earnings History Snapshot
Last quarter the company beat EPS by $0.20, which was followed by a 6.58% drop in the share price the next day.
Here's a look at IBM's past performance and the resulting price change:
| Quarter | Q1 2025 | Q4 2024 | Q3 2024 | Q2 2024 |
|---|---|---|---|---|
| EPS Estimate | 1.4 | 3.75 | 2.23 | 2.19 |
| EPS Actual | 1.6 | 3.92 | 2.30 | 2.43 |
| Price Change % | -7.000000000000001% | 13.0% | -6.0% | 4.0% |
Stock Performance
Shares of IBM were trading at $284.71 as of July 21. Over the last 52-week period, shares are up 54.38%. Given that these returns are generally positive, long-term shareholders are likely bullish going into this earnings release.
Analyst Observations about IBM
For investors, grasping market sentiments and expectations in the industry is vital. This analysis explores the latest insights regarding IBM.
A total of 13 analyst ratings have been received for IBM, with the consensus rating being Outperform. The average one-year price target stands at $281.0, suggesting a potential 1.3% downside.
Peer Ratings Comparison
In this comparison, we explore the analyst ratings and average 1-year price targets of Accenture, Infosys and Cognizant Tech Solns, three prominent industry players, offering insights into their relative performance expectations and market positioning.
- Analysts currently favor an Neutral trajectory for Accenture, with an average 1-year price target of $340.1, suggesting a potential 19.45% upside.
- Analysts currently favor an Neutral trajectory for Infosys, with an average 1-year price target of $18.0, suggesting a potential 93.68% downside.
- Analysts currently favor an Neutral trajectory for Cognizant Tech Solns, with an average 1-year price target of $86.67, suggesting a potential 69.56% downside.
Peers Comparative Analysis Summary
The peer analysis summary offers a detailed examination of key metrics for Accenture, Infosys and Cognizant Tech Solns, providing valuable insights into their respective standings within the industry and their market positions and comparative performance.
| Company | Consensus | Revenue Growth | Gross Profit | Return on Equity |
|---|---|---|---|---|
| IBM | Outperform | 0.55% | $8.03B | 3.89% |
| Accenture | Neutral | 7.66% | $5.83B | 7.35% |
| Infosys | Neutral | 3.61% | $1.43B | 7.56% |
| Cognizant Tech Solns | Neutral | 7.46% | $1.72B | 4.52% |
Key Takeaway:
IBM ranks at the bottom for Revenue Growth among its peers. It is in the middle for Gross Profit. For Return on Equity, IBM is at the bottom compared to its peers.
All You Need to Know About IBM
Incorporated in 1911, International Business Machines, or IBM, is one of the oldest technology companies in the world. It provides software, IT consulting services, and hardware to help business customers modernize their technology workflows. IBM operates in 175 countries and employs approximately 300,000 people. The company has a robust roster of business partners to service its clients, which includes 95% of all Fortune 500 companies. IBM's products, including Red Hat, watsonx, and mainframes, handle some of the world's most important data workloads in areas like finance and retail.
IBM: Financial Performance Dissected
Market Capitalization Analysis: The company's market capitalization is above the industry average, indicating that it is relatively larger in size compared to peers. This may suggest a higher level of investor confidence and market recognition.
Revenue Growth: IBM displayed positive results in 3 months. As of 31 March, 2025, the company achieved a solid revenue growth rate of approximately 0.55%. This indicates a notable increase in the company's top-line earnings. As compared to competitors, the company encountered difficulties, with a growth rate lower than the average among peers in the Information Technology sector.
Net Margin: IBM's financial strength is reflected in its exceptional net margin, which exceeds industry averages. With a remarkable net margin of 7.26%, the company showcases strong profitability and effective cost management.
Return on Equity (ROE): IBM's ROE surpasses industry standards, highlighting the company's exceptional financial performance. With an impressive 3.89% ROE, the company effectively utilizes shareholder equity capital.
Return on Assets (ROA): IBM's ROA surpasses industry standards, highlighting the company's exceptional financial performance. With an impressive 0.75% ROA, the company effectively utilizes its assets for optimal returns.
Debt Management: The company faces challenges in debt management with a debt-to-equity ratio higher than the industry average. With a ratio of 2.49, caution is advised due to increased financial risk.
To track all earnings releases for IBM visit their earnings calendar on our site.
This article was generated by Benzinga's automated content engine and reviewed by an editor.