Examining the Future: TE Connectivity's Earnings Outlook
TE Connectivity (NYSE:TEL) is set to give its latest quarterly earnings report on Wednesday, 2025-07-23. Here's what investors need to know before the announcement.
Analysts estimate that TE Connectivity will report an earnings per share (EPS) of $2.07.
Investors in TE Connectivity are eagerly awaiting the company's announcement, hoping for news of surpassing estimates and positive guidance for the next quarter.
It's worth noting for new investors that stock prices can be heavily influenced by future projections rather than just past performance.
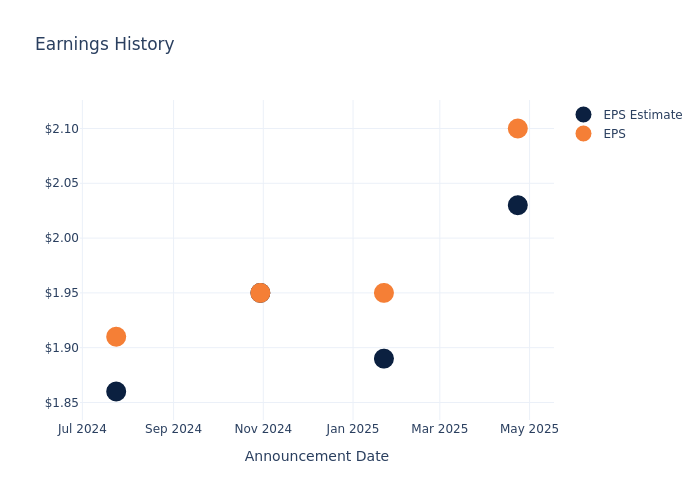
Earnings Track Record
The company's EPS beat by $0.07 in the last quarter, leading to a 5.48% increase in the share price on the following day.
Here's a look at TE Connectivity's past performance and the resulting price change:
| Quarter | Q2 2025 | Q1 2025 | Q4 2024 | Q3 2024 |
|---|---|---|---|---|
| EPS Estimate | 2.03 | 1.89 | 1.95 | 1.86 |
| EPS Actual | 2.10 | 1.95 | 1.95 | 1.91 |
| Price Change % | 5.0% | 1.0% | -3.0% | -1.0% |
TE Connectivity Share Price Analysis
Shares of TE Connectivity were trading at $179.51 as of July 21. Over the last 52-week period, shares are up 14.05%. Given that these returns are generally positive, long-term shareholders are likely bullish going into this earnings release.
Analyst Views on TE Connectivity
For investors, staying informed about market sentiments and expectations in the industry is paramount. This analysis provides an exploration of the latest insights on TE Connectivity.
With 12 analyst ratings, TE Connectivity has a consensus rating of Neutral. The average one-year price target is $171.33, indicating a potential 4.56% downside.
Peer Ratings Comparison
In this analysis, we delve into the analyst ratings and average 1-year price targets of Jabil, Flex and Celestica, three key industry players, offering insights into their relative performance expectations and market positioning.
- Analysts currently favor an Buy trajectory for Jabil, with an average 1-year price target of $218.33, suggesting a potential 21.63% upside.
- Analysts currently favor an Outperform trajectory for Flex, with an average 1-year price target of $53.67, suggesting a potential 70.1% downside.
- Analysts currently favor an Outperform trajectory for Celestica, with an average 1-year price target of $135.22, suggesting a potential 24.67% downside.
Peer Analysis Summary
Within the peer analysis summary, vital metrics for Jabil, Flex and Celestica are presented, shedding light on their respective standings within the industry and offering valuable insights into their market positions and comparative performance.
| Company | Consensus | Revenue Growth | Gross Profit | Return on Equity |
|---|---|---|---|---|
| TE Connectivity | Neutral | 4.44% | $1.46B | 0.11% |
| Jabil | Buy | 15.71% | $681M | 16.80% |
| Flex | Outperform | 3.71% | $563M | 4.44% |
| Celestica | Outperform | 19.91% | $273.90M | 4.99% |
Key Takeaway:
TE Connectivity ranks at the top for Gross Profit and Return on Equity among its peers. It is in the middle for Revenue Growth.
Discovering TE Connectivity: A Closer Look
TE Connectivity is the largest electrical connector supplier in the world, supplying interconnect and sensor solutions to the transportation, industrial, and communications markets. With operations in 150 countries and over 500,000 stock-keeping units, TE has a broad portfolio that forms the electrical architecture of its end customers' cutting-edge innovations.
Key Indicators: TE Connectivity's Financial Health
Market Capitalization Analysis: Above industry benchmarks, the company's market capitalization emphasizes a noteworthy size, indicative of a strong market presence.
Revenue Growth: TE Connectivity's revenue growth over a period of 3 months has been noteworthy. As of 31 March, 2025, the company achieved a revenue growth rate of approximately 4.44%. This indicates a substantial increase in the company's top-line earnings. As compared to competitors, the company surpassed expectations with a growth rate higher than the average among peers in the Information Technology sector.
Net Margin: The company's net margin is a standout performer, exceeding industry averages. With an impressive net margin of 0.31%, the company showcases strong profitability and effective cost control.
Return on Equity (ROE): TE Connectivity's ROE falls below industry averages, indicating challenges in efficiently using equity capital. With an ROE of 0.11%, the company may face hurdles in generating optimal returns for shareholders.
Return on Assets (ROA): The company's ROA is a standout performer, exceeding industry averages. With an impressive ROA of 0.06%, the company showcases effective utilization of assets.
Debt Management: TE Connectivity's debt-to-equity ratio is below industry norms, indicating a sound financial structure with a ratio of 0.46.
To track all earnings releases for TE Connectivity visit their earnings calendar on our site.
This article was generated by Benzinga's automated content engine and reviewed by an editor.