A Look at SS&C Techs Hldgs's Upcoming Earnings Report
SS&C Techs Hldgs (NASDAQ:SSNC) is set to give its latest quarterly earnings report on Wednesday, 2025-07-23. Here's what investors need to know before the announcement.
Analysts estimate that SS&C Techs Hldgs will report an earnings per share (EPS) of $1.34.
Investors in SS&C Techs Hldgs are eagerly awaiting the company's announcement, hoping for news of surpassing estimates and positive guidance for the next quarter.
It's worth noting for new investors that stock prices can be heavily influenced by future projections rather than just past performance.
Earnings Track Record
During the last quarter, the company reported an EPS beat by $0.03, leading to a 6.12% drop in the share price on the subsequent day.
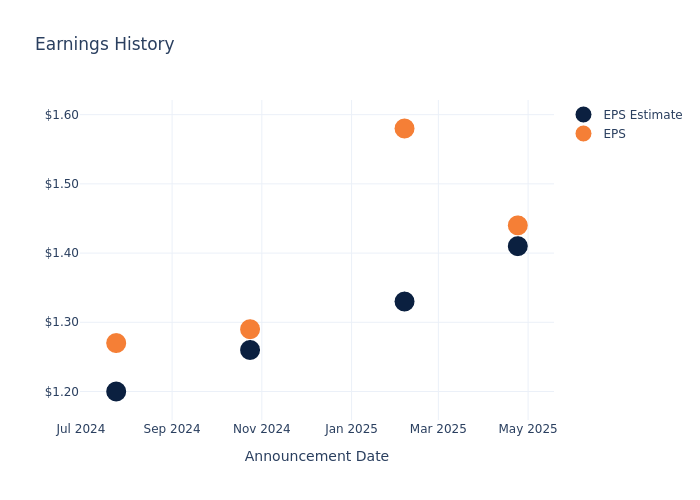
Here's a look at SS&C Techs Hldgs's past performance and the resulting price change:
| Quarter | Q1 2025 | Q4 2024 | Q3 2024 | Q2 2024 |
|---|---|---|---|---|
| EPS Estimate | 1.41 | 1.33 | 1.26 | 1.20 |
| EPS Actual | 1.44 | 1.58 | 1.29 | 1.27 |
| Price Change % | -6.0% | 6.0% | -7.000000000000001% | 6.0% |
Market Performance of SS&C Techs Hldgs's Stock
Shares of SS&C Techs Hldgs were trading at $83.21 as of July 21. Over the last 52-week period, shares are up 23.42%. Given that these returns are generally positive, long-term shareholders are likely bullish going into this earnings release.
Insights Shared by Analysts on SS&C Techs Hldgs
Understanding market sentiments and expectations within the industry is crucial for investors. This analysis delves into the latest insights on SS&C Techs Hldgs.
The consensus rating for SS&C Techs Hldgs is Buy, based on 5 analyst ratings. With an average one-year price target of $91.6, there's a potential 10.08% upside.
Comparing Ratings with Competitors
In this analysis, we delve into the analyst ratings and average 1-year price targets of Broadridge Financial Soln, Genpact and ExlService Hldgs, three key industry players, offering insights into their relative performance expectations and market positioning.
- Analysts currently favor an Buy trajectory for Broadridge Financial Soln, with an average 1-year price target of $279.5, suggesting a potential 235.9% upside.
- Analysts currently favor an Neutral trajectory for Genpact, with an average 1-year price target of $49.6, suggesting a potential 40.39% downside.
- Analysts currently favor an Buy trajectory for ExlService Hldgs, with an average 1-year price target of $54.0, suggesting a potential 35.1% downside.
Peer Analysis Summary
The peer analysis summary provides a snapshot of key metrics for Broadridge Financial Soln, Genpact and ExlService Hldgs, illuminating their respective standings within the industry. These metrics offer valuable insights into their market positions and comparative performance.
| Company | Consensus | Revenue Growth | Gross Profit | Return on Equity |
|---|---|---|---|---|
| SS&C Technologies Hldgs | Buy | 5.50% | $747.10M | 3.20% |
| Broadridge Financial Soln | Buy | 4.93% | $575.80M | 10.54% |
| Genpact | Neutral | 7.40% | $428.99M | 5.40% |
| ExlService Hldgs | Buy | 14.78% | $193.31M | 6.86% |
Key Takeaway:
SS&C Technologies Hldgs ranks at the top for Revenue Growth among its peers. It is in the middle for Gross Profit and Return on Equity.
Discovering SS&C Techs Hldgs: A Closer Look
SS&C Technologies provides software products and software-enabled services to a variety of customers primarily in financial services but also healthcare firms. SS&C GlobeOp provides fund administration services to alternative and traditional asset managers. In addition, SS&C provides portfolio accounting, portfolio management, trading, banking/lending, and other software to asset managers, banks, and financial advisors. SS&C's purchase of Intralinks makes it a leading player in virtual deal room solutions. With its 2018 purchase of DST Systems, SS&C gained a foothold in the healthcare industry with pharmacy health management solutions and medical claim administration services. In 2022, SS&C completed the acquisition of Blue Prism.
Financial Insights: SS&C Techs Hldgs
Market Capitalization Analysis: The company's market capitalization is above the industry average, indicating that it is relatively larger in size compared to peers. This may suggest a higher level of investor confidence and market recognition.
Revenue Growth: SS&C Techs Hldgs's revenue growth over a period of 3 months has been noteworthy. As of 31 March, 2025, the company achieved a revenue growth rate of approximately 5.5%. This indicates a substantial increase in the company's top-line earnings. In comparison to its industry peers, the company stands out with a growth rate higher than the average among peers in the Industrials sector.
Net Margin: SS&C Techs Hldgs's net margin is impressive, surpassing industry averages. With a net margin of 14.07%, the company demonstrates strong profitability and effective cost management.
Return on Equity (ROE): SS&C Techs Hldgs's ROE is below industry averages, indicating potential challenges in efficiently utilizing equity capital. With an ROE of 3.2%, the company may face hurdles in achieving optimal financial returns.
Return on Assets (ROA): SS&C Techs Hldgs's ROA lags behind industry averages, suggesting challenges in maximizing returns from its assets. With an ROA of 1.08%, the company may face hurdles in achieving optimal financial performance.
Debt Management: SS&C Techs Hldgs's debt-to-equity ratio is below the industry average. With a ratio of 1.04, the company relies less on debt financing, maintaining a healthier balance between debt and equity, which can be viewed positively by investors.
To track all earnings releases for SS&C Techs Hldgs visit their earnings calendar on our site.
This article was generated by Benzinga's automated content engine and reviewed by an editor.