What to Expect from SEI Inv's Earnings
SEI Inv (NASDAQ:SEIC) is set to give its latest quarterly earnings report on Wednesday, 2025-07-23. Here's what investors need to know before the announcement.
Analysts estimate that SEI Inv will report an earnings per share (EPS) of $1.16.
Anticipation surrounds SEI Inv's announcement, with investors hoping to hear about both surpassing estimates and receiving positive guidance for the next quarter.
New investors should understand that while earnings performance is important, market reactions are often driven by guidance.
Earnings Track Record
In the previous earnings release, the company beat EPS by $0.03, leading to a 7.81% increase in the share price the following trading session.
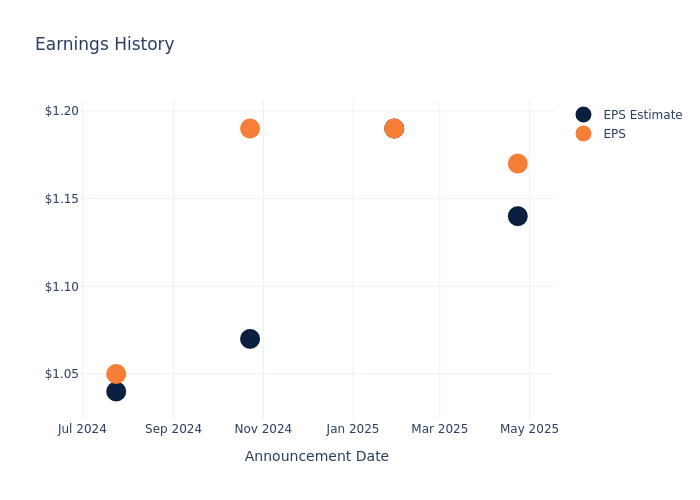
Here's a look at SEI Inv's past performance and the resulting price change:
| Quarter | Q1 2025 | Q4 2024 | Q3 2024 | Q2 2024 |
|---|---|---|---|---|
| EPS Estimate | 1.14 | 1.19 | 1.07 | 1.04 |
| EPS Actual | 1.17 | 1.19 | 1.19 | 1.05 |
| Price Change % | 8.0% | 4.0% | 5.0% | -0.0% |
Performance of SEI Inv Shares
Shares of SEI Inv were trading at $90.92 as of July 21. Over the last 52-week period, shares are up 36.72%. Given that these returns are generally positive, long-term shareholders are likely bullish going into this earnings release.
Analyst Opinions on SEI Inv
For investors, grasping market sentiments and expectations in the industry is vital. This analysis explores the latest insights regarding SEI Inv.
With 9 analyst ratings, SEI Inv has a consensus rating of Outperform. The average one-year price target is $91.56, indicating a potential 0.7% upside.
Comparing Ratings Among Industry Peers
In this comparison, we explore the analyst ratings and average 1-year price targets of Blue Owl Capital, Franklin Resources and Invesco, three prominent industry players, offering insights into their relative performance expectations and market positioning.
- Analysts currently favor an Outperform trajectory for Blue Owl Capital, with an average 1-year price target of $22.56, suggesting a potential 75.19% downside.
- Analysts currently favor an Neutral trajectory for Franklin Resources, with an average 1-year price target of $22.25, suggesting a potential 75.53% downside.
- Analysts currently favor an Neutral trajectory for Invesco, with an average 1-year price target of $16.75, suggesting a potential 81.58% downside.
Peer Metrics Summary
The peer analysis summary outlines pivotal metrics for Blue Owl Capital, Franklin Resources and Invesco, demonstrating their respective standings within the industry and offering valuable insights into their market positions and comparative performance.
| Company | Consensus | Revenue Growth | Gross Profit | Return on Equity |
|---|---|---|---|---|
| SEI Investments | Outperform | 7.77% | $303.95M | 6.72% |
| Blue Owl Capital | Outperform | 33.14% | $357.55M | 0.33% |
| Franklin Resources | Neutral | -1.92% | $1.67B | 1.11% |
| Invesco | Neutral | 3.65% | $555.60M | 1.61% |
Key Takeaway:
SEI Inv ranks highest in Revenue Growth among its peers. It also leads in Gross Profit. However, it has the lowest Return on Equity. Overall, SEI Inv is positioned at the top compared to its peers in terms of Revenue Growth and Gross Profit, but falls behind in Return on Equity.
Delving into SEI Inv's Background
SEI Investments provides investment processing, management, and operations services to financial institutions, asset managers, asset owners, and financial advisors in four material segments: private banks, investment advisors, institutional investors, and investment managers. SEI also has a minority interest in LSV Asset Management, a value equity asset manager with about $87 billion in assets under management. As of December 2024, SEI (including LSV) manages, administers, or advises about $1.6 trillion in assets.
SEI Inv: A Financial Overview
Market Capitalization Analysis: The company exhibits a lower market capitalization profile, positioning itself below industry averages. This suggests a smaller scale relative to peers.
Revenue Growth: Over the 3 months period, SEI Inv showcased positive performance, achieving a revenue growth rate of 7.77% as of 31 March, 2025. This reflects a substantial increase in the company's top-line earnings. When compared to others in the Financials sector, the company excelled with a growth rate higher than the average among peers.
Net Margin: SEI Inv's net margin lags behind industry averages, suggesting challenges in maintaining strong profitability. With a net margin of 27.48%, the company may face hurdles in effective cost management.
Return on Equity (ROE): SEI Inv's ROE excels beyond industry benchmarks, reaching 6.72%. This signifies robust financial management and efficient use of shareholder equity capital.
Return on Assets (ROA): SEI Inv's ROA stands out, surpassing industry averages. With an impressive ROA of 5.77%, the company demonstrates effective utilization of assets and strong financial performance.
Debt Management: SEI Inv's debt-to-equity ratio is below the industry average. With a ratio of 0.01, the company relies less on debt financing, maintaining a healthier balance between debt and equity, which can be viewed positively by investors.
To track all earnings releases for SEI Inv visit their earnings calendar on our site.
This article was generated by Benzinga's automated content engine and reviewed by an editor.