Preview: Cadence Design Sys's Earnings
Cadence Design Sys (NASDAQ:CDNS) is set to give its latest quarterly earnings report on Monday, 2025-07-28. Here's what investors need to know before the announcement.
Analysts estimate that Cadence Design Sys will report an earnings per share (EPS) of $1.42.
Cadence Design Sys bulls will hope to hear the company announce they've not only beaten that estimate, but also to provide positive guidance, or forecasted growth, for the next quarter.
New investors should note that it is sometimes not an earnings beat or miss that most affects the price of a stock, but the guidance (or forecast).
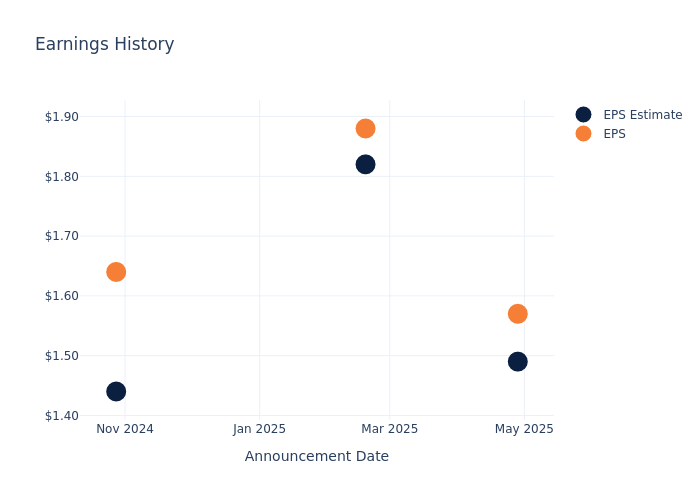
Past Earnings Performance
During the last quarter, the company reported an EPS beat by $0.08, leading to a 5.77% increase in the share price on the subsequent day.
Here's a look at Cadence Design Sys's past performance and the resulting price change:
| Quarter | Q1 2025 | Q4 2024 | Q3 2024 | Q2 2024 |
|---|---|---|---|---|
| EPS Estimate | 1.49 | 1.82 | 1.44 | 1.22 |
| EPS Actual | 1.57 | 1.88 | 1.64 | 1.28 |
| Price Change % | 6.0% | -9.0% | 13.0% | -1.0% |
Market Performance of Cadence Design Sys's Stock
Shares of Cadence Design Sys were trading at $324.64 as of July 24. Over the last 52-week period, shares are up 26.62%. Given that these returns are generally positive, long-term shareholders are likely bullish going into this earnings release.
Analyst Views on Cadence Design Sys
For investors, staying informed about market sentiments and expectations in the industry is paramount. This analysis provides an exploration of the latest insights on Cadence Design Sys.
A total of 14 analyst ratings have been received for Cadence Design Sys, with the consensus rating being Outperform. The average one-year price target stands at $342.0, suggesting a potential 5.35% upside.
Peer Ratings Comparison
This comparison focuses on the analyst ratings and average 1-year price targets of Synopsys, Autodesk and Workday, three major players in the industry, shedding light on their relative performance expectations and market positioning.
- Analysts currently favor an Buy trajectory for Synopsys, with an average 1-year price target of $621.82, suggesting a potential 91.54% upside.
- Analysts currently favor an Outperform trajectory for Autodesk, with an average 1-year price target of $344.95, suggesting a potential 6.26% upside.
- Analysts currently favor an Neutral trajectory for Workday, with an average 1-year price target of $289.2, suggesting a potential 10.92% downside.
Overview of Peer Analysis
In the peer analysis summary, key metrics for Synopsys, Autodesk and Workday are highlighted, providing an understanding of their respective standings within the industry and offering insights into their market positions and comparative performance.
| Company | Consensus | Revenue Growth | Gross Profit | Return on Equity |
|---|---|---|---|---|
| Cadence Design Systems | Outperform | 23.12% | $1.08B | 5.79% |
| Synopsys | Buy | 10.28% | $1.29B | 3.59% |
| Autodesk | Outperform | 15.24% | $1.47B | 5.80% |
| Workday | Neutral | 12.56% | $1.70B | 0.76% |
Key Takeaway:
Cadence Design Sys ranks at the top for Revenue Growth among its peers. It is in the middle for Gross Profit. For Return on Equity, it is also in the middle.
Discovering Cadence Design Sys: A Closer Look
Cadence Design Systems is a provider of electronic design automation software, intellectual property, and system design and analysis products. EDA software automates and aids in the chip design process, enhancing design accuracy, productivity, and complexity in a full-flow end-to-end solution. Cadence offers a portfolio of design IP, as well as system design and analysis products, which enables system-level analysis and verification solutions.
Financial Milestones: Cadence Design Sys's Journey
Market Capitalization: Indicating a reduced size compared to industry averages, the company's market capitalization poses unique challenges.
Revenue Growth: Cadence Design Sys's revenue growth over a period of 3 months has been noteworthy. As of 31 March, 2025, the company achieved a revenue growth rate of approximately 23.12%. This indicates a substantial increase in the company's top-line earnings. In comparison to its industry peers, the company stands out with a growth rate higher than the average among peers in the Information Technology sector.
Net Margin: The company's net margin is a standout performer, exceeding industry averages. With an impressive net margin of 22.02%, the company showcases strong profitability and effective cost control.
Return on Equity (ROE): Cadence Design Sys's ROE surpasses industry standards, highlighting the company's exceptional financial performance. With an impressive 5.79% ROE, the company effectively utilizes shareholder equity capital.
Return on Assets (ROA): Cadence Design Sys's ROA surpasses industry standards, highlighting the company's exceptional financial performance. With an impressive 3.04% ROA, the company effectively utilizes its assets for optimal returns.
Debt Management: Cadence Design Sys's debt-to-equity ratio is below the industry average at 0.52, reflecting a lower dependency on debt financing and a more conservative financial approach.
To track all earnings releases for Cadence Design Sys visit their earnings calendar on our site.
This article was generated by Benzinga's automated content engine and reviewed by an editor.