Earnings Preview: Veralto
Veralto (NYSE:VLTO) will release its quarterly earnings report on Monday, 2025-07-28. Here's a brief overview for investors ahead of the announcement.
Analysts anticipate Veralto to report an earnings per share (EPS) of $0.89.
The announcement from Veralto is eagerly anticipated, with investors seeking news of surpassing estimates and favorable guidance for the next quarter.
It's worth noting for new investors that guidance can be a key determinant of stock price movements.
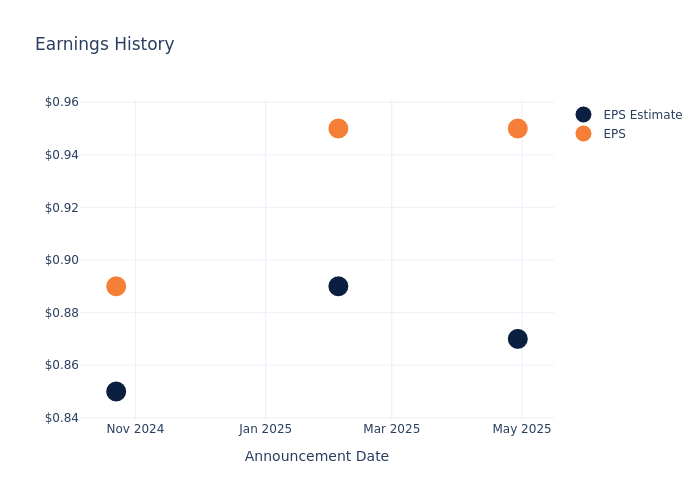
Historical Earnings Performance
The company's EPS beat by $0.08 in the last quarter, leading to a 3.02% increase in the share price on the following day.
Here's a look at Veralto's past performance and the resulting price change:
| Quarter | Q1 2025 | Q4 2024 | Q3 2024 | Q2 2024 |
|---|---|---|---|---|
| EPS Estimate | 0.87 | 0.89 | 0.85 | 0.80 |
| EPS Actual | 0.95 | 0.95 | 0.89 | 0.85 |
| Price Change % | 3.0% | -5.0% | -5.0% | 5.0% |
Performance of Veralto Shares
Shares of Veralto were trading at $103.27 as of July 24. Over the last 52-week period, shares are down 1.53%. Given that these returns are generally negative, long-term shareholders are likely a little upset going into this earnings release.
Insights Shared by Analysts on Veralto
For investors, grasping market sentiments and expectations in the industry is vital. This analysis explores the latest insights regarding Veralto.
Veralto has received a total of 4 ratings from analysts, with the consensus rating as Buy. With an average one-year price target of $107.5, the consensus suggests a potential 4.1% upside.
Peer Ratings Comparison
The below comparison of the analyst ratings and average 1-year price targets of Rollins, Clean Harbors and Tetra Tech, three prominent players in the industry, gives insights for their relative performance expectations and market positioning.
- Analysts currently favor an Outperform trajectory for Rollins, with an average 1-year price target of $64.0, suggesting a potential 38.03% downside.
- Analysts currently favor an Buy trajectory for Clean Harbors, with an average 1-year price target of $262.67, suggesting a potential 154.35% upside.
- Analysts currently favor an Neutral trajectory for Tetra Tech, with an average 1-year price target of $37.0, suggesting a potential 64.17% downside.
Snapshot: Peer Analysis
The peer analysis summary offers a detailed examination of key metrics for Rollins, Clean Harbors and Tetra Tech, providing valuable insights into their respective standings within the industry and their market positions and comparative performance.
| Company | Consensus | Revenue Growth | Gross Profit | Return on Equity |
|---|---|---|---|---|
| Veralto | Buy | 6.90% | $805M | 10.37% |
| Rollins | Outperform | 21.52% | $422.37M | 10.11% |
| Clean Harbors | Buy | 4.01% | $410.07M | 2.28% |
| Tetra Tech | Neutral | 5.63% | $214.18M | 0.33% |
Key Takeaway:
Veralto ranks highest in Revenue Growth among its peers. It also leads in Gross Profit margin. However, it falls behind in Return on Equity, where another peer outperforms. Overall, Veralto is positioned well compared to its peers in terms of financial performance metrics.
Unveiling the Story Behind Veralto
Veralto is a diversified industrial firm organized into two segments, water quality as well as product quality and innovation. The water quality segment offers water analytics and water treatment solutions, while the product quality and innovation segment offers coding, packaging, and color solutions for consumer packaged goods and pharmaceuticals. Headquartered in Waltham, Massachusetts, the company has around 17,000 employees. Veralto generated approximately $5.2 billion in revenue in 2024.
Financial Milestones: Veralto's Journey
Market Capitalization Analysis: Above industry benchmarks, the company's market capitalization emphasizes a noteworthy size, indicative of a strong market presence.
Revenue Growth: Veralto's revenue growth over a period of 3 months has been noteworthy. As of 31 March, 2025, the company achieved a revenue growth rate of approximately 6.9%. This indicates a substantial increase in the company's top-line earnings. In comparison to its industry peers, the company trails behind with a growth rate lower than the average among peers in the Industrials sector.
Net Margin: Veralto's financial strength is reflected in its exceptional net margin, which exceeds industry averages. With a remarkable net margin of 16.89%, the company showcases strong profitability and effective cost management.
Return on Equity (ROE): Veralto's ROE excels beyond industry benchmarks, reaching 10.37%. This signifies robust financial management and efficient use of shareholder equity capital.
Return on Assets (ROA): Veralto's ROA excels beyond industry benchmarks, reaching 3.45%. This signifies efficient management of assets and strong financial health.
Debt Management: Veralto's debt-to-equity ratio is below the industry average. With a ratio of 1.14, the company relies less on debt financing, maintaining a healthier balance between debt and equity, which can be viewed positively by investors.
To track all earnings releases for Veralto visit their earnings calendar on our site.
This article was generated by Benzinga's automated content engine and reviewed by an editor.