Preview: Hubbell's Earnings
Hubbell (NYSE:HUBB) is preparing to release its quarterly earnings on Tuesday, 2025-07-29. Here's a brief overview of what investors should keep in mind before the announcement.
Analysts expect Hubbell to report an earnings per share (EPS) of $4.38.
Investors in Hubbell are eagerly awaiting the company's announcement, hoping for news of surpassing estimates and positive guidance for the next quarter.
It's worth noting for new investors that stock prices can be heavily influenced by future projections rather than just past performance.
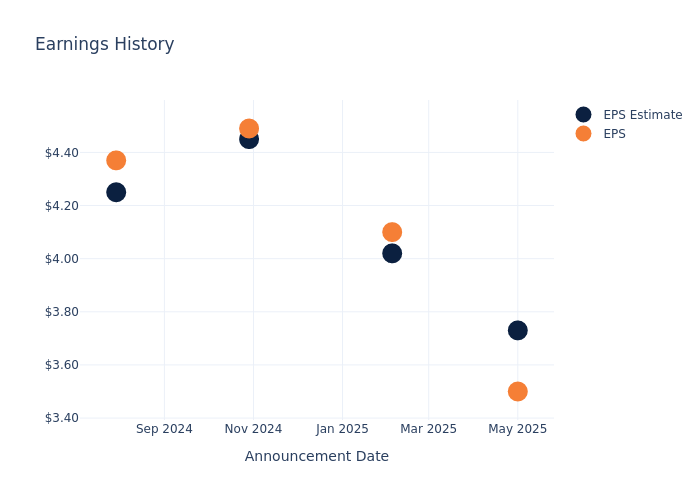
Performance in Previous Earnings
Last quarter the company missed EPS by $0.23, which was followed by a 3.73% increase in the share price the next day.
Here's a look at Hubbell's past performance and the resulting price change:
| Quarter | Q1 2025 | Q4 2024 | Q3 2024 | Q2 2024 |
|---|---|---|---|---|
| EPS Estimate | 3.73 | 4.02 | 4.45 | 4.25 |
| EPS Actual | 3.50 | 4.10 | 4.49 | 4.37 |
| Price Change % | 4.0% | -0.0% | -2.0% | 4.0% |
Market Performance of Hubbell's Stock
Shares of Hubbell were trading at $442.54 as of July 25. Over the last 52-week period, shares are up 16.07%. Given that these returns are generally positive, long-term shareholders should be satisfied going into this earnings release.
Analyst Views on Hubbell
Understanding market sentiments and expectations within the industry is crucial for investors. This analysis delves into the latest insights on Hubbell.
Analysts have provided Hubbell with 4 ratings, resulting in a consensus rating of Neutral. The average one-year price target stands at $417.75, suggesting a potential 5.6% downside.
Understanding Analyst Ratings Among Peers
The below comparison of the analyst ratings and average 1-year price targets of nVent Electric, Regal Rexnord and Nextracker, three prominent players in the industry, gives insights for their relative performance expectations and market positioning.
- Analysts currently favor an Outperform trajectory for nVent Electric, with an average 1-year price target of $79.67, suggesting a potential 82.0% downside.
- Analysts currently favor an Outperform trajectory for Regal Rexnord, with an average 1-year price target of $168.86, suggesting a potential 61.84% downside.
- Analysts currently favor an Outperform trajectory for Nextracker, with an average 1-year price target of $67.08, suggesting a potential 84.84% downside.
Analysis Summary for Peers
The peer analysis summary provides a snapshot of key metrics for nVent Electric, Regal Rexnord and Nextracker, illuminating their respective standings within the industry. These metrics offer valuable insights into their market positions and comparative performance.
| Company | Consensus | Revenue Growth | Gross Profit | Return on Equity |
|---|---|---|---|---|
| Hubbell | Neutral | -2.42% | $451.20M | 5.19% |
| nVent Electric | Outperform | 10.54% | $313.70M | 10.53% |
| Regal Rexnord | Outperform | -8.37% | $527.60M | 0.90% |
| Nextracker | Outperform | 25.50% | $305.69M | 10.33% |
Key Takeaway:
Hubbell ranks at the bottom for Revenue Growth among its peers. It is in the middle for Gross Profit. Hubbell is at the bottom for Return on Equity.
Discovering Hubbell: A Closer Look
Founded in 1888 by Harvey Hubbell, the eponymous company was the conduit through which the pull-chain lamp socket was originally sold. Hubbell has since grown into an electricity transmission and distribution behemoth, housing more than 75 brands that sell components found on power lines, electrical substations, and within commercial and industrial buildings. The company's primary operations are within the United States, where around 90% of revenue is derived.
Financial Milestones: Hubbell's Journey
Market Capitalization Analysis: Above industry benchmarks, the company's market capitalization emphasizes a noteworthy size, indicative of a strong market presence.
Negative Revenue Trend: Examining Hubbell's financials over 3 months reveals challenges. As of 31 March, 2025, the company experienced a decline of approximately -2.42% in revenue growth, reflecting a decrease in top-line earnings. In comparison to its industry peers, the company trails behind with a growth rate lower than the average among peers in the Industrials sector.
Net Margin: Hubbell's net margin excels beyond industry benchmarks, reaching 12.41%. This signifies efficient cost management and strong financial health.
Return on Equity (ROE): Hubbell's ROE surpasses industry standards, highlighting the company's exceptional financial performance. With an impressive 5.19% ROE, the company effectively utilizes shareholder equity capital.
Return on Assets (ROA): Hubbell's ROA surpasses industry standards, highlighting the company's exceptional financial performance. With an impressive 2.49% ROA, the company effectively utilizes its assets for optimal returns.
Debt Management: Hubbell's debt-to-equity ratio is below industry norms, indicating a sound financial structure with a ratio of 0.62.
To track all earnings releases for Hubbell visit their earnings calendar on our site.
This article was generated by Benzinga's automated content engine and reviewed by an editor.