Exploring Asbury Automotive Gr's Earnings Expectations
Asbury Automotive Gr (NYSE:ABG) is set to give its latest quarterly earnings report on Tuesday, 2025-07-29. Here's what investors need to know before the announcement.
Analysts estimate that Asbury Automotive Gr will report an earnings per share (EPS) of $6.85.
Anticipation surrounds Asbury Automotive Gr's announcement, with investors hoping to hear about both surpassing estimates and receiving positive guidance for the next quarter.
New investors should understand that while earnings performance is important, market reactions are often driven by guidance.
Overview of Past Earnings
Last quarter the company beat EPS by $0.16, which was followed by a 0.87% increase in the share price the next day.
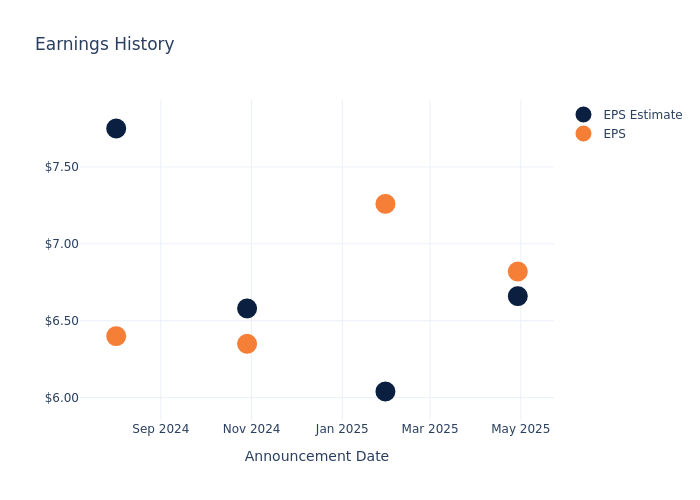
Here's a look at Asbury Automotive Gr's past performance and the resulting price change:
| Quarter | Q1 2025 | Q4 2024 | Q3 2024 | Q2 2024 |
|---|---|---|---|---|
| EPS Estimate | 6.66 | 6.04 | 6.58 | 7.75 |
| EPS Actual | 6.82 | 7.26 | 6.35 | 6.40 |
| Price Change % | 1.0% | -3.0% | 1.0% | -11.0% |
Asbury Automotive Gr Share Price Analysis
Shares of Asbury Automotive Gr were trading at $237.66 as of July 25. Over the last 52-week period, shares are down 11.72%. Given that these returns are generally negative, long-term shareholders are likely upset going into this earnings release.
Analysts' Take on Asbury Automotive Gr
Understanding market sentiments and expectations within the industry is crucial for investors. This analysis delves into the latest insights on Asbury Automotive Gr.
The consensus rating for Asbury Automotive Gr is Buy, based on 2 analyst ratings. With an average one-year price target of $280.0, there's a potential 17.82% upside.
Peer Ratings Overview
The following analysis focuses on the analyst ratings and average 1-year price targets of Valvoline, Group 1 Automotive and Advance Auto Parts, three prominent industry players, providing insights into their relative performance expectations and market positioning.
- Analysts currently favor an Neutral trajectory for Valvoline, with an average 1-year price target of $41.5, suggesting a potential 82.54% downside.
- Analysts currently favor an Buy trajectory for Group 1 Automotive, with an average 1-year price target of $491.67, suggesting a potential 106.88% upside.
- Analysts currently favor an Neutral trajectory for Advance Auto Parts, with an average 1-year price target of $48.11, suggesting a potential 79.76% downside.
Peers Comparative Analysis Summary
Within the peer analysis summary, vital metrics for Valvoline, Group 1 Automotive and Advance Auto Parts are presented, shedding light on their respective standings within the industry and offering valuable insights into their market positions and comparative performance.
| Company | Consensus | Revenue Growth | Gross Profit | Return on Equity |
|---|---|---|---|---|
| Asbury Automotive Group | Buy | -1.26% | $724.20M | 3.71% |
| Valvoline | Neutral | 3.73% | $150.50M | 15.72% |
| Group 1 Automotive | Buy | 21.45% | $935.80M | 4.59% |
| Advance Auto Parts | Neutral | -6.82% | $1.11B | 1.10% |
Key Takeaway:
Asbury Automotive Group ranks at the bottom for Revenue Growth among its peers. It is in the middle for Gross Profit. The company is at the bottom for Return on Equity.
All You Need to Know About Asbury Automotive Gr
Asbury Automotive Group is a regional collection of automobile dealerships that went public in March 2002. The company operates 152 new-vehicle stores and 37 collision centers. Over 70% of new-vehicle revenue is from luxury and import brands. Asbury also offers third-party financing and insurance products and its own F&I products via Total Care Auto. Asbury operates in 14 states (mostly Texas, the West, the Mid-Atlantic, and the Southeast). Asbury store brands include McDavid and Park Place in Texas, Koons in the Washington, D.C. area, and the Larry H. Miller brand in the Western US. Asbury generated $17.2 billion of revenue in 2024 and is based in the Atlanta area. The firm targets at least $30 billion of revenue sometime around 2030.
Unraveling the Financial Story of Asbury Automotive Gr
Market Capitalization Analysis: Reflecting a smaller scale, the company's market capitalization is positioned below industry averages. This could be attributed to factors such as growth expectations or operational capacity.
Revenue Challenges: Asbury Automotive Gr's revenue growth over 3 months faced difficulties. As of 31 March, 2025, the company experienced a decline of approximately -1.26%. This indicates a decrease in top-line earnings. As compared to competitors, the company encountered difficulties, with a growth rate lower than the average among peers in the Consumer Discretionary sector.
Net Margin: Asbury Automotive Gr's net margin excels beyond industry benchmarks, reaching 3.18%. This signifies efficient cost management and strong financial health.
Return on Equity (ROE): Asbury Automotive Gr's financial strength is reflected in its exceptional ROE, which exceeds industry averages. With a remarkable ROE of 3.71%, the company showcases efficient use of equity capital and strong financial health.
Return on Assets (ROA): Asbury Automotive Gr's ROA surpasses industry standards, highlighting the company's exceptional financial performance. With an impressive 1.29% ROA, the company effectively utilizes its assets for optimal returns.
Debt Management: With a below-average debt-to-equity ratio of 1.33, Asbury Automotive Gr adopts a prudent financial strategy, indicating a balanced approach to debt management.
To track all earnings releases for Asbury Automotive Gr visit their earnings calendar on our site.
This article was generated by Benzinga's automated content engine and reviewed by an editor.