Silgan Hldgs's Earnings: A Preview
Silgan Hldgs (NYSE:SLGN) is gearing up to announce its quarterly earnings on Wednesday, 2025-07-30. Here's a quick overview of what investors should know before the release.
Analysts are estimating that Silgan Hldgs will report an earnings per share (EPS) of $1.03.
The announcement from Silgan Hldgs is eagerly anticipated, with investors seeking news of surpassing estimates and favorable guidance for the next quarter.
It's worth noting for new investors that guidance can be a key determinant of stock price movements.
Historical Earnings Performance
Last quarter the company beat EPS by $0.03, which was followed by a 2.05% increase in the share price the next day.
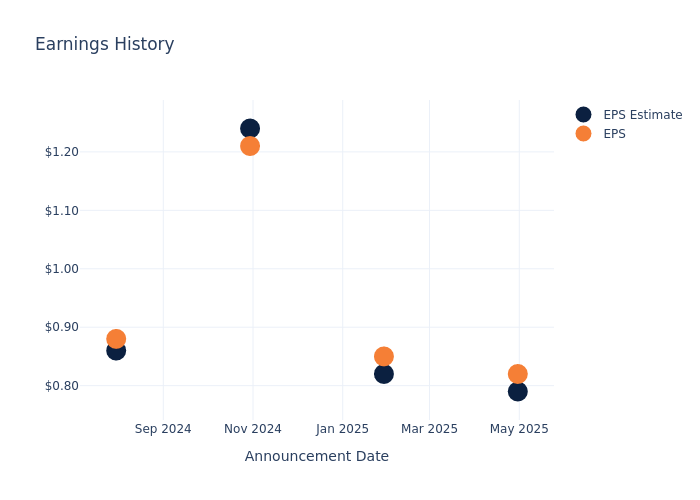
Here's a look at Silgan Hldgs's past performance and the resulting price change:
| Quarter | Q1 2025 | Q4 2024 | Q3 2024 | Q2 2024 |
|---|---|---|---|---|
| EPS Estimate | 0.79 | 0.82 | 1.24 | 0.86 |
| EPS Actual | 0.82 | 0.85 | 1.21 | 0.88 |
| Price Change % | 2.0% | 1.0% | -1.0% | 2.0% |
Market Performance of Silgan Hldgs's Stock
Shares of Silgan Hldgs were trading at $55.47 as of July 28. Over the last 52-week period, shares are up 7.73%. Given that these returns are generally positive, long-term shareholders should be satisfied going into this earnings release.
Analyst Insights on Silgan Hldgs
For investors, grasping market sentiments and expectations in the industry is vital. This analysis explores the latest insights regarding Silgan Hldgs.
A total of 6 analyst ratings have been received for Silgan Hldgs, with the consensus rating being Buy. The average one-year price target stands at $62.0, suggesting a potential 11.77% upside.
Understanding Analyst Ratings Among Peers
The analysis below examines the analyst ratings and average 1-year price targets of and Greif, three significant industry players, providing valuable insights into their relative performance expectations and market positioning.
- Analysts currently favor an Outperform trajectory for Greif, with an average 1-year price target of $72.0, suggesting a potential 29.8% upside.
Peer Analysis Summary
The peer analysis summary provides a snapshot of key metrics for and Greif, illuminating their respective standings within the industry. These metrics offer valuable insights into their market positions and comparative performance.
| Company | Consensus | Revenue Growth | Gross Profit | Return on Equity |
|---|---|---|---|---|
| Silgan Hldgs | Buy | 11.36% | $270.40M | 3.34% |
| Greif | Outperform | 1.07% | $319.50M | 2.27% |
Key Takeaway:
Silgan Hldgs has higher revenue growth compared to its peer. Silgan Hldgs has lower gross profit than its peer. Silgan Hldgs has higher return on equity than its peer.
Get to Know Silgan Hldgs Better
Silgan Holdings manufactures about half of the metal food containers in North America. Its major customers include Campbell Soup, Nestle, and Del Monte. Silgan's other business segments include plastic dispensers and containers for personal and healthcare products and a closures business that manufactures metal and plastic lids and caps.
Breaking Down Silgan Hldgs's Financial Performance
Market Capitalization Analysis: The company exhibits a lower market capitalization profile, positioning itself below industry averages. This suggests a smaller scale relative to peers.
Revenue Growth: Over the 3 months period, Silgan Hldgs showcased positive performance, achieving a revenue growth rate of 11.36% as of 31 March, 2025. This reflects a substantial increase in the company's top-line earnings. When compared to others in the Materials sector, the company excelled with a growth rate higher than the average among peers.
Net Margin: Silgan Hldgs's net margin surpasses industry standards, highlighting the company's exceptional financial performance. With an impressive 4.63% net margin, the company effectively manages costs and achieves strong profitability.
Return on Equity (ROE): Silgan Hldgs's ROE surpasses industry standards, highlighting the company's exceptional financial performance. With an impressive 3.34% ROE, the company effectively utilizes shareholder equity capital.
Return on Assets (ROA): Silgan Hldgs's ROA is below industry standards, pointing towards difficulties in efficiently utilizing assets. With an ROA of 0.78%, the company may encounter challenges in delivering satisfactory returns from its assets.
Debt Management: Silgan Hldgs's debt-to-equity ratio stands notably higher than the industry average, reaching 2.22. This indicates a heavier reliance on borrowed funds, raising concerns about financial leverage.
To track all earnings releases for Silgan Hldgs visit their earnings calendar on our site.
This article was generated by Benzinga's automated content engine and reviewed by an editor.