Examining the Future: Skyward Specialty's Earnings Outlook
Skyward Specialty (NASDAQ:SKWD) is preparing to release its quarterly earnings on Wednesday, 2025-07-30. Here's a brief overview of what investors should keep in mind before the announcement.
Analysts expect Skyward Specialty to report an earnings per share (EPS) of $0.86.
The announcement from Skyward Specialty is eagerly anticipated, with investors seeking news of surpassing estimates and favorable guidance for the next quarter.
It's worth noting for new investors that guidance can be a key determinant of stock price movements.
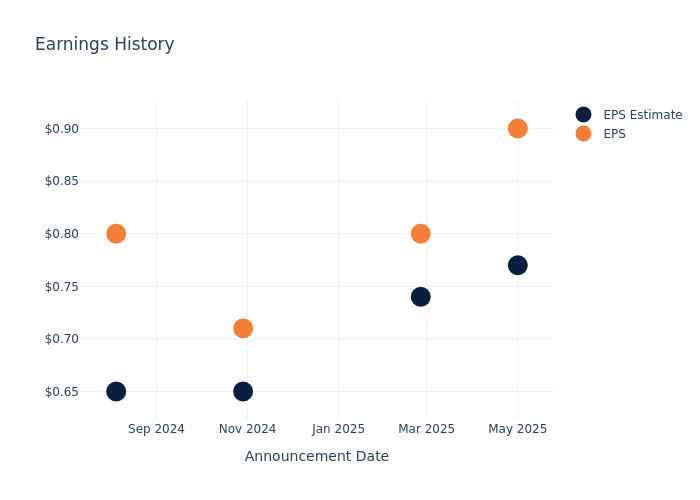
Earnings History Snapshot
Last quarter the company beat EPS by $0.13, which was followed by a 9.45% increase in the share price the next day.
Here's a look at Skyward Specialty's past performance and the resulting price change:
| Quarter | Q1 2025 | Q4 2024 | Q3 2024 | Q2 2024 |
|---|---|---|---|---|
| EPS Estimate | 0.77 | 0.74 | 0.65 | 0.65 |
| EPS Actual | 0.90 | 0.80 | 0.71 | 0.80 |
| Price Change % | 9.0% | -1.0% | -1.0% | -2.0% |
Tracking Skyward Specialty's Stock Performance
Shares of Skyward Specialty were trading at $51.02 as of July 28. Over the last 52-week period, shares are up 28.48%. Given that these returns are generally positive, long-term shareholders are likely bullish going into this earnings release.
Insights Shared by Analysts on Skyward Specialty
For investors, grasping market sentiments and expectations in the industry is vital. This analysis explores the latest insights regarding Skyward Specialty.
A total of 5 analyst ratings have been received for Skyward Specialty, with the consensus rating being Outperform. The average one-year price target stands at $68.0, suggesting a potential 33.28% upside.
Peer Ratings Overview
The following analysis focuses on the analyst ratings and average 1-year price targets of and Trupanion, three prominent industry players, providing insights into their relative performance expectations and market positioning.
Insights: Peer Analysis
The peer analysis summary presents essential metrics for and Trupanion, unveiling their respective standings within the industry and providing valuable insights into their market positions and comparative performance.
| Company | Consensus | Revenue Growth | Gross Profit | Return on Equity |
|---|---|---|---|---|
| Trupanion | Buy | 11.71% | $51.10M | -0.45% |
Key Takeaway:
Skyward Specialty ranks at the bottom for Revenue Growth among its peers, with a growth rate of 11.71%. In terms of Gross Profit, Skyward Specialty is also at the bottom with $51.10M. Additionally, the company's Return on Equity is negative at -0.45%, placing it at the bottom compared to its peers.
About Skyward Specialty
Skyward Specialty Insurance Group Inc is a specialty insurance company that delivers commercial property and casualty products and solutions on a non-admitted and admitted basis. The firm has one reportable segment through which it offers a broad array of insurance coverages to several market niches. It operates multiple lines of business, including general liability, excess liability, professional liability, commercial auto, group accident, health, property, surety, and workers' compensation.
Key Indicators: Skyward Specialty's Financial Health
Market Capitalization: Indicating a reduced size compared to industry averages, the company's market capitalization poses unique challenges.
Revenue Growth: Skyward Specialty's revenue growth over a period of 3 months has been noteworthy. As of 31 March, 2025, the company achieved a revenue growth rate of approximately 25.26%. This indicates a substantial increase in the company's top-line earnings. In comparison to its industry peers, the company stands out with a growth rate higher than the average among peers in the Financials sector.
Net Margin: Skyward Specialty's net margin excels beyond industry benchmarks, reaching 12.72%. This signifies efficient cost management and strong financial health.
Return on Equity (ROE): Skyward Specialty's ROE excels beyond industry benchmarks, reaching 5.11%. This signifies robust financial management and efficient use of shareholder equity capital.
Return on Assets (ROA): Skyward Specialty's financial strength is reflected in its exceptional ROA, which exceeds industry averages. With a remarkable ROA of 1.08%, the company showcases efficient use of assets and strong financial health.
Debt Management: Skyward Specialty's debt-to-equity ratio is below the industry average at 0.14, reflecting a lower dependency on debt financing and a more conservative financial approach.
To track all earnings releases for Skyward Specialty visit their earnings calendar on our site.
This article was generated by Benzinga's automated content engine and reviewed by an editor.