Examining the Future: Exelon's Earnings Outlook
Exelon (NASDAQ:EXC) is gearing up to announce its quarterly earnings on Thursday, 2025-07-31. Here's a quick overview of what investors should know before the release.
Analysts are estimating that Exelon will report an earnings per share (EPS) of $0.39.
The announcement from Exelon is eagerly anticipated, with investors seeking news of surpassing estimates and favorable guidance for the next quarter.
It's worth noting for new investors that guidance can be a key determinant of stock price movements.
Overview of Past Earnings
During the last quarter, the company reported an EPS beat by $0.04, leading to a 0.26% drop in the share price on the subsequent day.
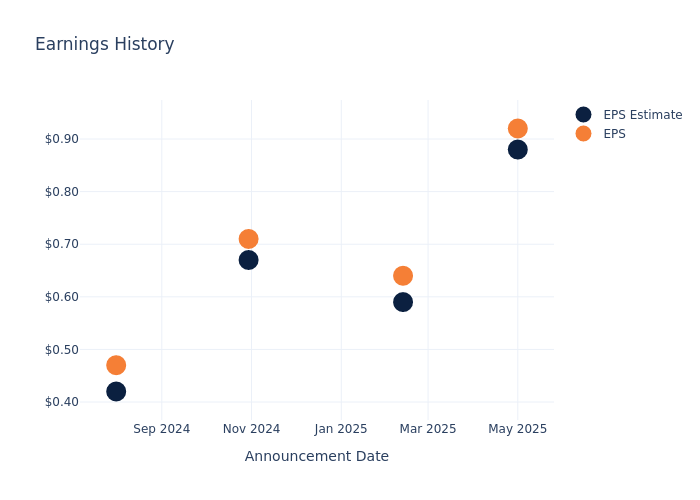
Here's a look at Exelon's past performance and the resulting price change:
| Quarter | Q1 2025 | Q4 2024 | Q3 2024 | Q2 2024 |
|---|---|---|---|---|
| EPS Estimate | 0.88 | 0.59 | 0.67 | 0.42 |
| EPS Actual | 0.92 | 0.64 | 0.71 | 0.47 |
| Price Change % | -0.0% | 0.0% | -1.0% | 1.0% |
Performance of Exelon Shares
Shares of Exelon were trading at $44.3 as of July 29. Over the last 52-week period, shares are up 16.01%. Given that these returns are generally positive, long-term shareholders are likely bullish going into this earnings release.
Analyst Observations about Exelon
For investors, grasping market sentiments and expectations in the industry is vital. This analysis explores the latest insights regarding Exelon.
Exelon has received a total of 8 ratings from analysts, with the consensus rating as Neutral. With an average one-year price target of $46.38, the consensus suggests a potential 4.7% upside.
Peer Ratings Comparison
The below comparison of the analyst ratings and average 1-year price targets of Xcel Energy, Entergy and NRG Energy, three prominent players in the industry, gives insights for their relative performance expectations and market positioning.
- Analysts currently favor an Neutral trajectory for Xcel Energy, with an average 1-year price target of $77.5, suggesting a potential 74.94% upside.
- Analysts currently favor an Outperform trajectory for Entergy, with an average 1-year price target of $89.0, suggesting a potential 100.9% upside.
- Analysts currently favor an Buy trajectory for NRG Energy, with an average 1-year price target of $178.43, suggesting a potential 302.78% upside.
Peers Comparative Analysis Summary
Within the peer analysis summary, vital metrics for Xcel Energy, Entergy and NRG Energy are presented, shedding light on their respective standings within the industry and offering valuable insights into their market positions and comparative performance.
| Company | Consensus | Revenue Growth | Gross Profit | Return on Equity |
|---|---|---|---|---|
| Exelon | Neutral | 11.10% | $2.85B | 3.33% |
| Xcel Energy | Neutral | 7.04% | $1.69B | 2.46% |
| Entergy | Outperform | 1.87% | $1.45B | 2.38% |
| NRG Energy | Buy | 15.56% | $2.02B | 37.07% |
Key Takeaway:
Exelon ranks highest in gross profit among its peers. It is in the middle for revenue growth. Exelon's return on equity is the lowest among the group. The consensus rating for Exelon is neutral, similar to some peers.
All You Need to Know About Exelon
Exelon serves approximately 10 million power and gas customers at its six regulated utilities in Illinois, Pennsylvania, Maryland, New Jersey, Delaware, and Washington, D.C.
Unraveling the Financial Story of Exelon
Market Capitalization Analysis: The company's market capitalization is above the industry average, indicating that it is relatively larger in size compared to peers. This may suggest a higher level of investor confidence and market recognition.
Revenue Growth: Exelon displayed positive results in 3 months. As of 31 March, 2025, the company achieved a solid revenue growth rate of approximately 11.1%. This indicates a notable increase in the company's top-line earnings. When compared to others in the Utilities sector, the company excelled with a growth rate higher than the average among peers.
Net Margin: Exelon's net margin is impressive, surpassing industry averages. With a net margin of 13.52%, the company demonstrates strong profitability and effective cost management.
Return on Equity (ROE): Exelon's ROE lags behind industry averages, suggesting challenges in maximizing returns on equity capital. With an ROE of 3.33%, the company may face hurdles in achieving optimal financial performance.
Return on Assets (ROA): Exelon's financial strength is reflected in its exceptional ROA, which exceeds industry averages. With a remarkable ROA of 0.84%, the company showcases efficient use of assets and strong financial health.
Debt Management: Exelon's debt-to-equity ratio is notably higher than the industry average. With a ratio of 1.75, the company relies more heavily on borrowed funds, indicating a higher level of financial risk.
To track all earnings releases for Exelon visit their earnings calendar on our site.
This article was generated by Benzinga's automated content engine and reviewed by an editor.