Earnings Outlook For Trinity Industries
Trinity Industries (NYSE:TRN) is preparing to release its quarterly earnings on Thursday, 2025-07-31. Here's a brief overview of what investors should keep in mind before the announcement.
Analysts expect Trinity Industries to report an earnings per share (EPS) of $0.28.
The announcement from Trinity Industries is eagerly anticipated, with investors seeking news of surpassing estimates and favorable guidance for the next quarter.
It's worth noting for new investors that guidance can be a key determinant of stock price movements.
Historical Earnings Performance
During the last quarter, the company reported an EPS missed by $0.04, leading to a 2.5% increase in the share price on the subsequent day.
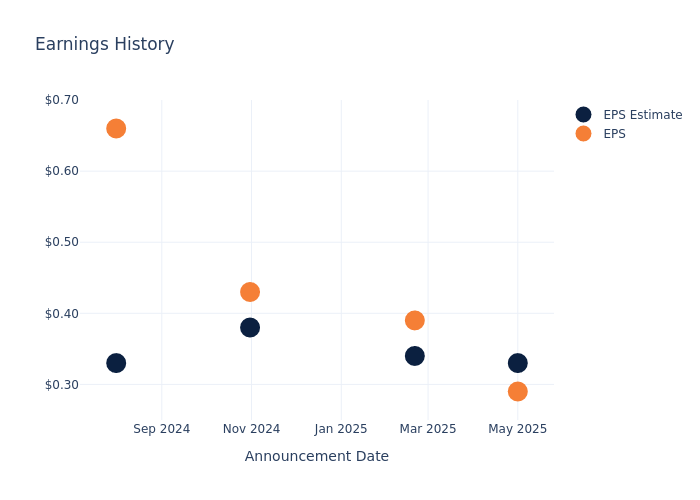
Here's a look at Trinity Industries's past performance and the resulting price change:
| Quarter | Q1 2025 | Q4 2024 | Q3 2024 | Q2 2024 |
|---|---|---|---|---|
| EPS Estimate | 0.33 | 0.34 | 0.38 | 0.33 |
| EPS Actual | 0.29 | 0.39 | 0.43 | 0.66 |
| Price Change % | 3.0% | -4.0% | -5.0% | -7.000000000000001% |
Stock Performance
Shares of Trinity Industries were trading at $25.29 as of July 29. Over the last 52-week period, shares are down 30.6%. Given that these returns are generally negative, long-term shareholders are likely bearish going into this earnings release.
Analyst Views on Trinity Industries
For investors, grasping market sentiments and expectations in the industry is vital. This analysis explores the latest insights regarding Trinity Industries.
A total of 1 analyst ratings have been received for Trinity Industries, with the consensus rating being Neutral. The average one-year price target stands at $24.0, suggesting a potential 5.1% downside.
Comparing Ratings with Peers
The below comparison of the analyst ratings and average 1-year price targets of REV Group, Greenbrier Companies and Blue Bird, three prominent players in the industry, gives insights for their relative performance expectations and market positioning.
- Analysts currently favor an Buy trajectory for REV Group, with an average 1-year price target of $43.2, suggesting a potential 70.82% upside.
- Analysts currently favor an Outperform trajectory for Greenbrier Companies, with an average 1-year price target of $57.0, suggesting a potential 125.39% upside.
- Analysts currently favor an Buy trajectory for Blue Bird, with an average 1-year price target of $49.5, suggesting a potential 95.73% upside.
Peer Metrics Summary
The peer analysis summary provides a snapshot of key metrics for REV Group, Greenbrier Companies and Blue Bird, illuminating their respective standings within the industry. These metrics offer valuable insights into their market positions and comparative performance.
| Company | Consensus | Revenue Growth | Gross Profit | Return on Equity |
|---|---|---|---|---|
| Trinity Indus | Neutral | -27.69% | $142.20M | 2.09% |
| REV Group | Buy | 1.98% | $95.70M | 4.83% |
| Greenbrier Companies | Outperform | 2.74% | $151.50M | 4.06% |
| Blue Bird | Buy | 3.74% | $70.85M | 14.08% |
Key Takeaway:
Trinity Industries ranks at the bottom for Revenue Growth among its peers. It also ranks at the bottom for Gross Profit. However, Trinity Industries ranks in the middle for Return on Equity.
Delving into Trinity Industries's Background
Trinity Industries Inc. sells and leases railroad products and railcar maintenance services in North America. The company operates under the name TrinityRail in three main segments: railcar leasing and management services, which owns railcars and provides fleet management and administration services; rail products, which builds, sells, and modifies freight and tank railcars and their components; and all other, which sells highway products such as guardrail and other highway barriers. Customers include railroads, leasing companies, and shipping companies in agriculture, construction, consumer products, energy, and chemicals.
Trinity Industries: Financial Performance Dissected
Market Capitalization Analysis: The company exhibits a lower market capitalization profile, positioning itself below industry averages. This suggests a smaller scale relative to peers.
Revenue Challenges: Trinity Industries's revenue growth over 3 months faced difficulties. As of 31 March, 2025, the company experienced a decline of approximately -27.69%. This indicates a decrease in top-line earnings. In comparison to its industry peers, the company trails behind with a growth rate lower than the average among peers in the Industrials sector.
Net Margin: Trinity Industries's net margin is below industry averages, indicating potential challenges in maintaining strong profitability. With a net margin of 3.78%, the company may face hurdles in effective cost management.
Return on Equity (ROE): Trinity Industries's ROE falls below industry averages, indicating challenges in efficiently using equity capital. With an ROE of 2.09%, the company may face hurdles in generating optimal returns for shareholders.
Return on Assets (ROA): Trinity Industries's ROA is below industry averages, indicating potential challenges in efficiently utilizing assets. With an ROA of 0.25%, the company may face hurdles in achieving optimal financial returns.
Debt Management: Trinity Industries's debt-to-equity ratio is notably higher than the industry average. With a ratio of 5.33, the company relies more heavily on borrowed funds, indicating a higher level of financial risk.
To track all earnings releases for Trinity Industries visit their earnings calendar on our site.
This article was generated by Benzinga's automated content engine and reviewed by an editor.