Insights Ahead: Paramount Global's Quarterly Earnings
Paramount Global (NASDAQ:PARA) will release its quarterly earnings report on Thursday, 2025-07-31. Here's a brief overview for investors ahead of the announcement.
Analysts anticipate Paramount Global to report an earnings per share (EPS) of $0.37.
The market awaits Paramount Global's announcement, with hopes high for news of surpassing estimates and providing upbeat guidance for the next quarter.
It's important for new investors to understand that guidance can be a significant driver of stock prices.
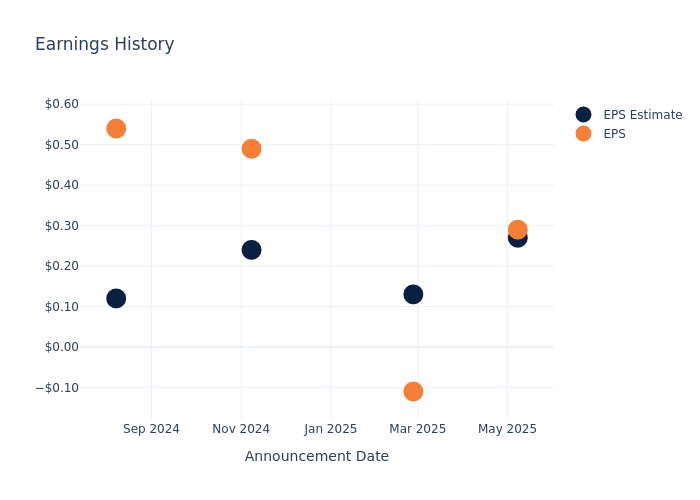
Historical Earnings Performance
During the last quarter, the company reported an EPS beat by $0.02, leading to a 2.23% increase in the share price on the subsequent day.
Here's a look at Paramount Global's past performance and the resulting price change:
| Quarter | Q1 2025 | Q4 2024 | Q3 2024 | Q2 2024 |
|---|---|---|---|---|
| EPS Estimate | 0.27 | 0.13 | 0.24 | 0.12 |
| EPS Actual | 0.29 | -0.11 | 0.49 | 0.54 |
| Price Change % | 2.0% | 0.0% | -4.0% | 1.0% |
Tracking Paramount Global's Stock Performance
Shares of Paramount Global were trading at $13.25 as of July 29. Over the last 52-week period, shares are up 19.26%. Given that these returns are generally positive, long-term shareholders are likely bullish going into this earnings release.
Analysts' Perspectives on Paramount Global
Understanding market sentiments and expectations within the industry is crucial for investors. This analysis delves into the latest insights on Paramount Global.
A total of 7 analyst ratings have been received for Paramount Global, with the consensus rating being Buy. The average one-year price target stands at $12.0, suggesting a potential 9.43% downside.
Understanding Analyst Ratings Among Peers
In this analysis, we delve into the analyst ratings and average 1-year price targets of Nexstar Media Gr and Tegna, three key industry players, offering insights into their relative performance expectations and market positioning.
- Analysts currently favor an Outperform trajectory for Nexstar Media Gr, with an average 1-year price target of $207.0, suggesting a potential 1462.26% upside.
- Analysts currently favor an Buy trajectory for Tegna, with an average 1-year price target of $20.5, suggesting a potential 54.72% upside.
Comprehensive Peer Analysis Summary
In the peer analysis summary, key metrics for Nexstar Media Gr and Tegna are highlighted, providing an understanding of their respective standings within the industry and offering insights into their market positions and comparative performance.
| Company | Consensus | Revenue Growth | Gross Profit | Return on Equity |
|---|---|---|---|---|
| Paramount Glb | Buy | -6.42% | $2.23B | 0.93% |
| Nexstar Media Gr | Outperform | -3.89% | $683M | 4.80% |
| Tegna | Buy | -4.79% | $239.06M | 1.92% |
Key Takeaway:
Paramount Global ranks at the bottom for Revenue Growth among its peers. It is in the middle for Gross Profit. For Return on Equity, Paramount Global is at the bottom compared to its peers.
All You Need to Know About Paramount Global
Paramount Global operates in three global business segments: TV media, filmed entertainment, and direct to consumer. The TV media business includes television production studios and various broadcast and cable networks, including CBS, 15 owned CBS affiliates, Paramount, Nickelodeon, MTV, BET, and VH1. Filmed entertainment consists multiple film studios, most importantly Paramount Pictures. The film studios produce and distribute movies that they license to movie theaters and other media outlets. Direct to consumer includes the Paramount+, Pluto TV, and BET+ streaming services. Much of the content on Paramount's streaming platforms is created by the production studios housed within the firm's other two business segments.
Understanding the Numbers: Paramount Global's Finances
Market Capitalization Analysis: With a profound presence, the company's market capitalization is above industry averages. This reflects substantial size and strong market recognition.
Decline in Revenue: Over the 3 months period, Paramount Global faced challenges, resulting in a decline of approximately -6.42% in revenue growth as of 31 March, 2025. This signifies a reduction in the company's top-line earnings. In comparison to its industry peers, the company trails behind with a growth rate lower than the average among peers in the Communication Services sector.
Net Margin: The company's net margin is a standout performer, exceeding industry averages. With an impressive net margin of 2.11%, the company showcases strong profitability and effective cost control.
Return on Equity (ROE): Paramount Global's ROE stands out, surpassing industry averages. With an impressive ROE of 0.93%, the company demonstrates effective use of equity capital and strong financial performance.
Return on Assets (ROA): Paramount Global's ROA surpasses industry standards, highlighting the company's exceptional financial performance. With an impressive 0.33% ROA, the company effectively utilizes its assets for optimal returns.
Debt Management: Paramount Global's debt-to-equity ratio is below the industry average at 0.94, reflecting a lower dependency on debt financing and a more conservative financial approach.
To track all earnings releases for Paramount Global visit their earnings calendar on our site.
This article was generated by Benzinga's automated content engine and reviewed by an editor.