Earnings Outlook For Allegiant Travel
Allegiant Travel (NASDAQ:ALGT) will release its quarterly earnings report on Monday, 2025-08-04. Here's a brief overview for investors ahead of the announcement.
Analysts anticipate Allegiant Travel to report an earnings per share (EPS) of $0.84.
Anticipation surrounds Allegiant Travel's announcement, with investors hoping to hear about both surpassing estimates and receiving positive guidance for the next quarter.
New investors should understand that while earnings performance is important, market reactions are often driven by guidance.
Historical Earnings Performance
During the last quarter, the company reported an EPS beat by $0.26, leading to a 3.66% increase in the share price on the subsequent day.
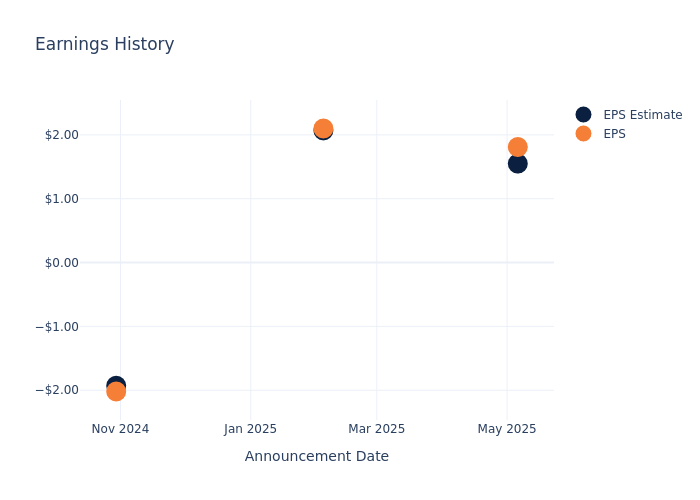
Here's a look at Allegiant Travel's past performance and the resulting price change:
| Quarter | Q1 2025 | Q4 2024 | Q3 2024 | Q2 2024 |
|---|---|---|---|---|
| EPS Estimate | 1.55 | 2.07 | -1.93 | 0.77 |
| EPS Actual | 1.81 | 2.10 | -2.02 | 1.77 |
| Price Change % | 4.0% | -15.0% | 3.0% | -11.0% |
Stock Performance
Shares of Allegiant Travel were trading at $51.64 as of July 31. Over the last 52-week period, shares are up 14.31%. Given that these returns are generally positive, long-term shareholders are likely bullish going into this earnings release.
Analyst Opinions on Allegiant Travel
For investors, grasping market sentiments and expectations in the industry is vital. This analysis explores the latest insights regarding Allegiant Travel.
Analysts have provided Allegiant Travel with 8 ratings, resulting in a consensus rating of Neutral. The average one-year price target stands at $67.38, suggesting a potential 30.48% upside.
Understanding Analyst Ratings Among Peers
The below comparison of the analyst ratings and average 1-year price targets of Frontier Group Holdings, Sun Country Airlines and JetBlue Airways, three prominent players in the industry, gives insights for their relative performance expectations and market positioning.
- Analysts currently favor an Neutral trajectory for Frontier Group Holdings, with an average 1-year price target of $5.67, suggesting a potential 89.02% downside.
- Analysts currently favor an Neutral trajectory for Sun Country Airlines, with an average 1-year price target of $16.0, suggesting a potential 69.02% downside.
- Analysts currently favor an Neutral trajectory for JetBlue Airways, with an average 1-year price target of $4.0, suggesting a potential 92.25% downside.
Analysis Summary for Peers
The peer analysis summary outlines pivotal metrics for Frontier Group Holdings, Sun Country Airlines and JetBlue Airways, demonstrating their respective standings within the industry and offering valuable insights into their market positions and comparative performance.
| Company | Consensus | Revenue Growth | Gross Profit | Return on Equity |
|---|---|---|---|---|
| Allegiant Travel | Neutral | 6.50% | $123.71M | 2.84% |
| Frontier Group Holdings | Neutral | 5.43% | $13M | -7.33% |
| Sun Country Airlines | Neutral | 4.87% | $97.28M | 6.23% |
| JetBlue Airways | Neutral | -2.97% | $440M | -3.05% |
Key Takeaway:
Allegiant Travel ranks highest in Revenue Growth among its peers. It also leads in Gross Profit. However, it has the lowest Return on Equity.
About Allegiant Travel
Allegiant Travel Co is a leisure travel company focused on providing travel and leisure services and products to residents of under-served cities in the United States. It operates a low-cost, low utilization passenger airline marketed to leisure travelers in under-served cities, allowing it to sell air transportation both on a stand-alone basis and bundled with the sale of air-related and third-party services and products. In addition, it provides air transportation under fixed-fee flight arrangements. In connection with its leisure travel focus, the company has opened Sunseeker Resort Charlotte Harbor, equipped with several guestrooms and food and beverage outlets. The company's operating segments are the Airline, which generates maximum revenue, and Sunseeker Resort.
Key Indicators: Allegiant Travel's Financial Health
Market Capitalization Perspectives: The company's market capitalization falls below industry averages, signaling a relatively smaller size compared to peers. This positioning may be influenced by factors such as perceived growth potential or operational scale.
Revenue Growth: Allegiant Travel's remarkable performance in 3 months is evident. As of 31 March, 2025, the company achieved an impressive revenue growth rate of 6.5%. This signifies a substantial increase in the company's top-line earnings. When compared to others in the Industrials sector, the company excelled with a growth rate higher than the average among peers.
Net Margin: Allegiant Travel's net margin excels beyond industry benchmarks, reaching 4.47%. This signifies efficient cost management and strong financial health.
Return on Equity (ROE): Allegiant Travel's ROE stands out, surpassing industry averages. With an impressive ROE of 2.84%, the company demonstrates effective use of equity capital and strong financial performance.
Return on Assets (ROA): Allegiant Travel's ROA surpasses industry standards, highlighting the company's exceptional financial performance. With an impressive 0.7% ROA, the company effectively utilizes its assets for optimal returns.
Debt Management: The company maintains a balanced debt approach with a debt-to-equity ratio below industry norms, standing at 1.88.
To track all earnings releases for Allegiant Travel visit their earnings calendar on our site.
This article was generated by Benzinga's automated content engine and reviewed by an editor.