A Preview Of Lyft's Earnings
Lyft (NASDAQ:LYFT) is set to give its latest quarterly earnings report on Wednesday, 2025-08-06. Here's what investors need to know before the announcement.
Analysts estimate that Lyft will report an earnings per share (EPS) of $0.05.
Anticipation surrounds Lyft's announcement, with investors hoping to hear about both surpassing estimates and receiving positive guidance for the next quarter.
New investors should understand that while earnings performance is important, market reactions are often driven by guidance.
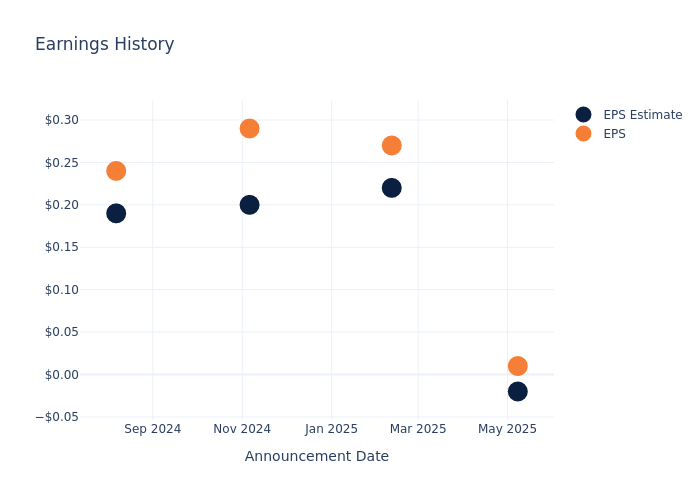
Past Earnings Performance
In the previous earnings release, the company beat EPS by $0.03, leading to a 28.08% increase in the share price the following trading session.
Here's a look at Lyft's past performance and the resulting price change:
| Quarter | Q1 2025 | Q4 2024 | Q3 2024 | Q2 2024 |
|---|---|---|---|---|
| EPS Estimate | -0.02 | 0.22 | 0.20 | 0.19 |
| EPS Actual | 0.01 | 0.27 | 0.29 | 0.24 |
| Price Change % | 28.000000000000004% | -8.0% | 23.0% | 11.0% |
Stock Performance
Shares of Lyft were trading at $14.08 as of August 04. Over the last 52-week period, shares are up 59.53%. Given that these returns are generally positive, long-term shareholders are likely bullish going into this earnings release.
Analyst Opinions on Lyft
For investors, staying informed about market sentiments and expectations in the industry is paramount. This analysis provides an exploration of the latest insights on Lyft.
Analysts have given Lyft a total of 14 ratings, with the consensus rating being Neutral. The average one-year price target is $17.86, indicating a potential 26.85% upside.
Comparing Ratings with Peers
In this comparison, we explore the analyst ratings and average 1-year price targets of and Uber Technologies, three prominent industry players, offering insights into their relative performance expectations and market positioning.
- Analysts currently favor an Buy trajectory for Uber Technologies, with an average 1-year price target of $103.74, suggesting a potential 636.79% upside.
Peer Metrics Summary
The peer analysis summary outlines pivotal metrics for and Uber Technologies, demonstrating their respective standings within the industry and offering valuable insights into their market positions and comparative performance.
| Company | Consensus | Revenue Growth | Gross Profit | Return on Equity |
|---|---|---|---|---|
| Lyft | Neutral | 13.54% | $587.30M | 0.32% |
| Uber Technologies | Buy | 13.84% | $4.60B | 8.16% |
Key Takeaway:
Lyft is positioned at the bottom for Revenue Growth and Gross Profit, while its peers are showing higher figures. However, Lyft's Return on Equity is significantly lower compared to its peers. Overall, Lyft's performance is weaker in terms of financial metrics when compared to its peers.
Discovering Lyft: A Closer Look
Lyft is the second-largest ride-sharing service provider in the US and Canada, connecting riders and drivers over the Lyft app. Incorporated in 2013 and public since 2019, Lyft offers a variety of rides via private vehicles, including traditional private rides, shared rides, and luxury ones. Besides ride-share, Lyft has entered the bike- and scooter-share market to bring multimodal transportation options to users.
Understanding the Numbers: Lyft's Finances
Market Capitalization Analysis: Falling below industry benchmarks, the company's market capitalization reflects a reduced size compared to peers. This positioning may be influenced by factors such as growth expectations or operational capacity.
Positive Revenue Trend: Examining Lyft's financials over 3 months reveals a positive narrative. The company achieved a noteworthy revenue growth rate of 13.54% as of 31 March, 2025, showcasing a substantial increase in top-line earnings. As compared to competitors, the company encountered difficulties, with a growth rate lower than the average among peers in the Industrials sector.
Net Margin: Lyft's net margin lags behind industry averages, suggesting challenges in maintaining strong profitability. With a net margin of 0.18%, the company may face hurdles in effective cost management.
Return on Equity (ROE): Lyft's ROE falls below industry averages, indicating challenges in efficiently using equity capital. With an ROE of 0.32%, the company may face hurdles in generating optimal returns for shareholders.
Return on Assets (ROA): Lyft's ROA is below industry averages, indicating potential challenges in efficiently utilizing assets. With an ROA of 0.05%, the company may face hurdles in achieving optimal financial returns.
Debt Management: Lyft's debt-to-equity ratio stands notably higher than the industry average, reaching 1.41. This indicates a heavier reliance on borrowed funds, raising concerns about financial leverage.
To track all earnings releases for Lyft visit their earnings calendar on our site.
This article was generated by Benzinga's automated content engine and reviewed by an editor.