Assessing NVIDIA's Performance Against Competitors In Semiconductors & Semiconductor Equipment Industry
In the dynamic and cutthroat world of business, conducting thorough company analysis is essential for investors and industry experts. In this article, we will undertake a comprehensive industry comparison, evaluating NVIDIA (NASDAQ:NVDA) and its primary competitors in the Semiconductors & Semiconductor Equipment industry. By closely examining key financial metrics, market position, and growth prospects, our aim is to provide valuable insights for investors and shed light on company's performance within the industry.
NVIDIA Background
Nvidia is a leading developer of graphics processing units. Traditionally, GPUs were used to enhance the experience on computing platforms, most notably in gaming applications on PCs. GPU use cases have since emerged as important semiconductors used in artificial intelligence. Nvidia not only offers AI GPUs, but also a software platform, Cuda, used for AI model development and training. Nvidia is also expanding its data center networking solutions, helping to tie GPUs together to handle complex workloads.
| Company | P/E | P/B | P/S | ROE | EBITDA (in billions) | Gross Profit (in billions) | Revenue Growth |
|---|---|---|---|---|---|---|---|
| NVIDIA Corp | 56.04 | 50.53 | 28.93 | 23.01% | $22.58 | $26.67 | 69.18% |
| Broadcom Inc | 105.34 | 19.51 | 24.43 | 7.12% | $8.02 | $10.2 | 20.16% |
| Advanced Micro Devices Inc | 125.33 | 4.81 | 10.11 | 1.23% | $1.59 | $3.74 | 35.9% |
| Texas Instruments Inc | 33.06 | 10.02 | 9.95 | 7.85% | $2.09 | $2.58 | 16.38% |
| Qualcomm Inc | 14.30 | 5.88 | 3.82 | 9.71% | $3.52 | $5.76 | 10.35% |
| ARM Holdings PLC | 208.45 | 20.80 | 35.53 | 1.88% | $0.17 | $1.02 | 12.14% |
| Micron Technology Inc | 18.90 | 2.31 | 3.51 | 3.79% | $4.33 | $3.51 | 36.56% |
| Analog Devices Inc | 60.25 | 3.14 | 11.26 | 1.63% | $1.2 | $1.61 | 22.28% |
| ON Semiconductor Corp | 39.46 | 2.96 | 3.66 | -5.78% | $-0.37 | $0.29 | -22.39% |
| STMicroelectronics NV | 36.32 | 1.26 | 1.94 | -0.55% | $0.46 | $0.93 | -14.42% |
| ASE Technology Holding Co Ltd | 19.87 | 2.21 | 1.06 | 2.49% | $26.99 | $25.69 | 7.5% |
| First Solar Inc | 15.73 | 2.31 | 4.55 | 4.09% | $0.49 | $0.5 | 8.58% |
| Credo Technology Group Holding Ltd | 370.79 | 27.08 | 44.60 | 5.63% | $0.04 | $0.11 | 179.73% |
| United Microelectronics Corp | 12.18 | 1.52 | 2.12 | 2.45% | $24.98 | $16.88 | 3.45% |
| Skyworks Solutions Inc | 26.43 | 1.71 | 2.75 | 1.11% | $0.22 | $0.39 | -8.87% |
| Qorvo Inc | 98.91 | 2.27 | 2.18 | 0.75% | $0.12 | $0.33 | -7.66% |
| Rambus Inc | 34.33 | 6.35 | 12.18 | 4.85% | $0.08 | $0.14 | 30.33% |
| Universal Display Corp | 28.30 | 4.02 | 10.44 | 3.99% | $0.08 | $0.13 | 8.38% |
| Average | 73.41 | 6.95 | 10.83 | 3.07% | $4.35 | $4.34 | 19.91% |
Upon a comprehensive analysis of NVIDIA, the following trends can be discerned:
-
The Price to Earnings ratio of 56.04 is 0.76x lower than the industry average, indicating potential undervaluation for the stock.
-
The elevated Price to Book ratio of 50.53 relative to the industry average by 7.27x suggests company might be overvalued based on its book value.
-
With a relatively high Price to Sales ratio of 28.93, which is 2.67x the industry average, the stock might be considered overvalued based on sales performance.
-
The Return on Equity (ROE) of 23.01% is 19.94% above the industry average, highlighting efficient use of equity to generate profits.
-
The company has higher Earnings Before Interest, Taxes, Depreciation, and Amortization (EBITDA) of $22.58 Billion, which is 5.19x above the industry average, indicating stronger profitability and robust cash flow generation.
-
The company has higher gross profit of $26.67 Billion, which indicates 6.15x above the industry average, indicating stronger profitability and higher earnings from its core operations.
-
The company's revenue growth of 69.18% is notably higher compared to the industry average of 19.91%, showcasing exceptional sales performance and strong demand for its products or services.
Debt To Equity Ratio
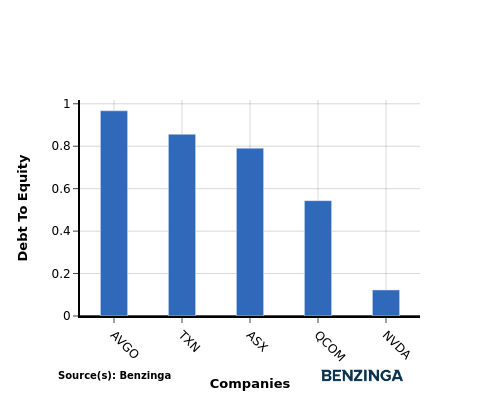
The debt-to-equity (D/E) ratio assesses the extent to which a company relies on borrowed funds compared to its equity.
Considering the debt-to-equity ratio in industry comparisons allows for a concise evaluation of a company's financial health and risk profile, aiding in informed decision-making.
When examining NVIDIA in comparison to its top 4 peers with respect to the Debt-to-Equity ratio, the following information becomes apparent:
-
When comparing the debt-to-equity ratio, NVIDIA is in a stronger financial position compared to its top 4 peers.
-
The company has a lower level of debt relative to its equity, indicating a more favorable balance between the two with a lower debt-to-equity ratio of 0.12.
Key Takeaways
For NVIDIA, the PE ratio is low compared to peers, indicating potential undervaluation. The high PB and PS ratios suggest strong market sentiment and revenue multiples. In terms of ROE, EBITDA, gross profit, and revenue growth, NVIDIA outperforms industry peers, reflecting strong financial performance and growth prospects in the semiconductor sector.
This article was generated by Benzinga's automated content engine and reviewed by an editor.
Posted-In: BZI-IANews Markets Trading Ideas