Inquiry Into Microsoft's Competitor Dynamics In Software Industry
In the fast-paced and cutthroat world of business, conducting thorough company analysis is essential for investors and industry experts. In this article, we will undertake a comprehensive industry comparison, evaluating Microsoft (NASDAQ:MSFT) in comparison to its major competitors within the Software industry. By analyzing crucial financial metrics, market position, and growth potential, our objective is to provide valuable insights for investors and offer a deeper understanding of company's performance in the industry.
Microsoft Background
Microsoft develops and licenses consumer and enterprise software. It is known for its Windows operating systems and Office productivity suite. The company is organized into three equally sized broad segments: productivity and business processes (legacy Microsoft Office, cloud-based Office 365, Exchange, SharePoint, Skype, LinkedIn, Dynamics), intelligence cloud (infrastructure- and platform-as-a-service offerings Azure, Windows Server OS, SQL Server), and more personal computing (Windows Client, Xbox, Bing search, display advertising, and Surface laptops, tablets, and desktops).
| Company | P/E | P/B | P/S | ROE | EBITDA (in billions) | Gross Profit (in billions) | Revenue Growth |
|---|---|---|---|---|---|---|---|
| Microsoft Corp | 38.42 | 11.34 | 13.89 | 8.19% | $44.43 | $52.43 | 18.1% |
| Oracle Corp | 56.32 | 33.57 | 12.20 | 18.43% | $6.83 | $11.16 | 11.31% |
| ServiceNow Inc | 115.02 | 17.36 | 15.87 | 3.65% | $0.65 | $2.49 | 22.38% |
| Palo Alto Networks Inc | 99.36 | 15.97 | 13.80 | 3.85% | $0.4 | $1.67 | 15.33% |
| Fortinet Inc | 40.07 | 37.96 | 12.26 | 25.08% | $0.56 | $1.25 | 13.77% |
| Gen Digital Inc | 27.93 | 7.81 | 4.56 | 6.43% | $0.53 | $0.81 | 4.77% |
| Monday.Com Ltd | 250.52 | 11.70 | 12.72 | 2.57% | $0.01 | $0.25 | 30.12% |
| CommVault Systems Inc | 100.32 | 21.89 | 7.72 | 6.81% | $0.03 | $0.23 | 25.51% |
| Dolby Laboratories Inc | 25.86 | 2.58 | 5.07 | 1.78% | $0.07 | $0.27 | 9.25% |
| Qualys Inc | 26.71 | 9.53 | 7.80 | 9.75% | $0.06 | $0.13 | 9.67% |
| Progress Software Corp | 35.42 | 4.38 | 2.36 | 3.85% | $0.08 | $0.19 | 35.57% |
| Teradata Corp | 14.26 | 12.17 | 1.15 | 30.24% | $0.09 | $0.25 | -10.11% |
| N-able Inc | 96.88 | 1.89 | 3.11 | -0.93% | $0.01 | $0.09 | 3.91% |
| Rapid7 Inc | 49.66 | 24.81 | 1.51 | 5.98% | $0.02 | $0.15 | 2.51% |
| Average | 72.18 | 15.51 | 7.7 | 9.04% | $0.72 | $1.46 | 13.38% |
By carefully studying Microsoft, we can deduce the following trends:
-
With a Price to Earnings ratio of 38.42, which is 0.53x less than the industry average, the stock shows potential for growth at a reasonable price, making it an interesting consideration for market participants.
-
Considering a Price to Book ratio of 11.34, which is well below the industry average by 0.73x, the stock may be undervalued based on its book value compared to its peers.
-
The stock's relatively high Price to Sales ratio of 13.89, surpassing the industry average by 1.8x, may indicate an aspect of overvaluation in terms of sales performance.
-
The Return on Equity (ROE) of 8.19% is 0.85% below the industry average, suggesting potential inefficiency in utilizing equity to generate profits.
-
The company has higher Earnings Before Interest, Taxes, Depreciation, and Amortization (EBITDA) of $44.43 Billion, which is 61.71x above the industry average, indicating stronger profitability and robust cash flow generation.
-
Compared to its industry, the company has higher gross profit of $52.43 Billion, which indicates 35.91x above the industry average, indicating stronger profitability and higher earnings from its core operations.
-
With a revenue growth of 18.1%, which surpasses the industry average of 13.38%, the company is demonstrating robust sales expansion and gaining market share.
Debt To Equity Ratio
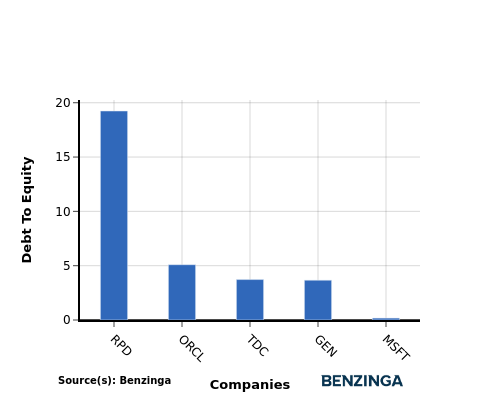
The debt-to-equity (D/E) ratio is an important measure to assess the financial structure and risk profile of a company.
Considering the debt-to-equity ratio in industry comparisons allows for a concise evaluation of a company's financial health and risk profile, aiding in informed decision-making.
In terms of the Debt-to-Equity ratio, Microsoft stands in comparison with its top 4 peers, leading to the following comparisons:
-
When considering the debt-to-equity ratio, Microsoft exhibits a stronger financial position compared to its top 4 peers.
-
This indicates that the company has a favorable balance between debt and equity, with a lower debt-to-equity ratio of 0.18, which can be perceived as a positive aspect by investors.
Key Takeaways
For Microsoft in the Software industry, the PE ratio is low compared to peers, indicating potential undervaluation. The PB ratio is also low, suggesting a possible bargain opportunity. However, the PS ratio is high, signaling rich valuation based on revenue. In terms of ROE, Microsoft shows lower profitability compared to peers. EBITDA and gross profit margins are high, reflecting strong operational performance. Additionally, Microsoft's revenue growth rate is high, indicating robust top-line expansion relative to industry peers.
This article was generated by Benzinga's automated content engine and reviewed by an editor.
Posted-In: BZI-IANews Markets Trading Ideas