This Is What Whales Are Betting On Amazon.com
Whales with a lot of money to spend have taken a noticeably bullish stance on Amazon.com.
Looking at options history for Amazon.com (NASDAQ:AMZN) we detected 12 trades.
If we consider the specifics of each trade, it is accurate to state that 50% of the investors opened trades with bullish expectations and 25% with bearish.
From the overall spotted trades, 3 are puts, for a total amount of $140,500 and 9, calls, for a total amount of $370,559.
What's The Price Target?
Taking into account the Volume and Open Interest on these contracts, it appears that whales have been targeting a price range from $120.0 to $235.0 for Amazon.com over the last 3 months.
Analyzing Volume & Open Interest
In terms of liquidity and interest, the mean open interest for Amazon.com options trades today is 11707.5 with a total volume of 12,600.00.
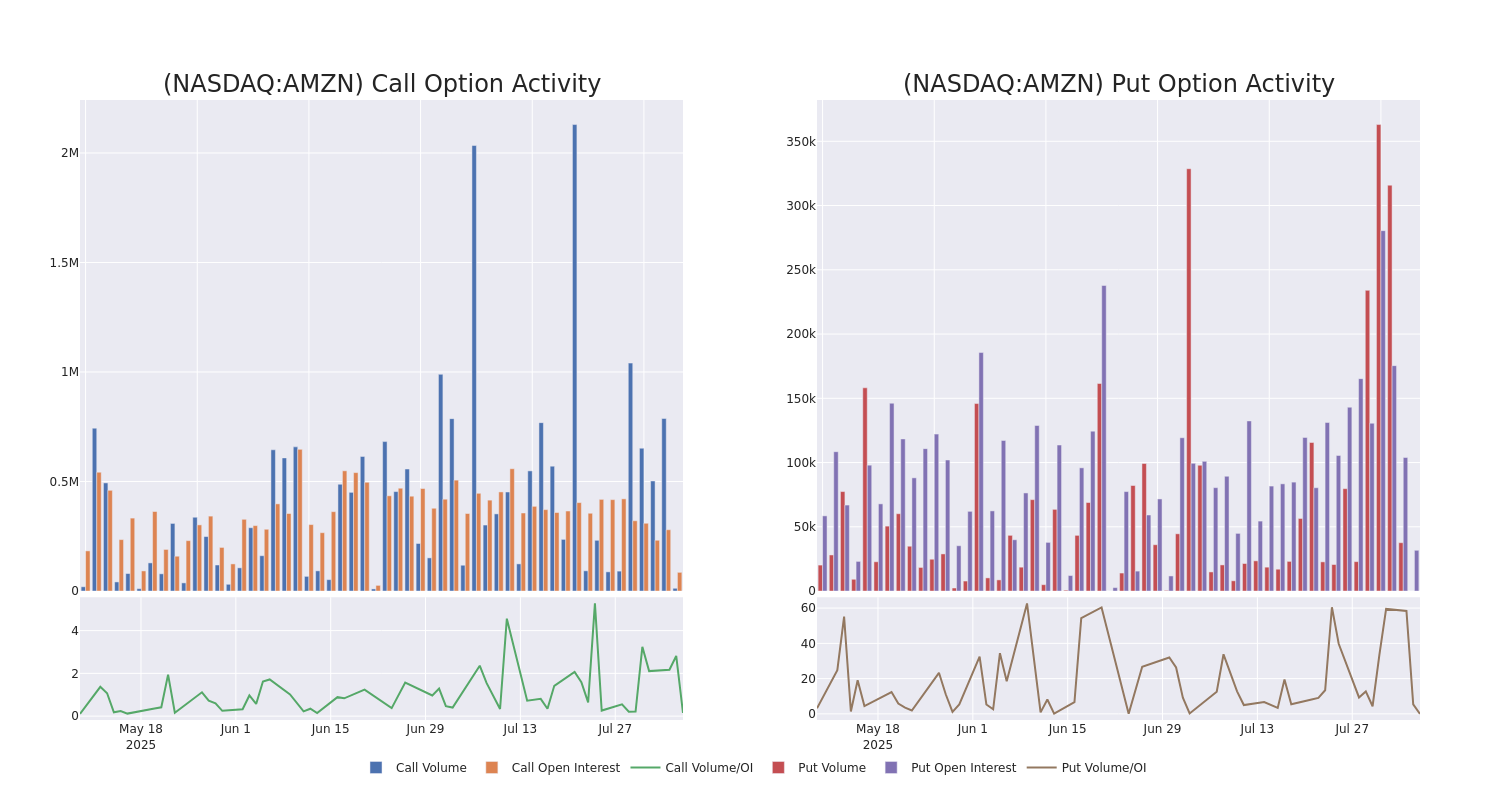
In the following chart, we are able to follow the development of volume and open interest of call and put options for Amazon.com's big money trades within a strike price range of $120.0 to $235.0 over the last 30 days.
Amazon.com Call and Put Volume: 30-Day Overview
Biggest Options Spotted:
| Symbol | PUT/CALL | Trade Type | Sentiment | Exp. Date | Ask | Bid | Price | Strike Price | Total Trade Price | Open Interest | Volume |
|---|---|---|---|---|---|---|---|---|---|---|---|
| AMZN | PUT | TRADE | BULLISH | 01/16/26 | $12.6 | $12.45 | $12.5 | $210.00 | $62.5K | 11.4K | 0 |
| AMZN | CALL | TRADE | BEARISH | 08/08/25 | $0.32 | $0.31 | $0.31 | $220.00 | $61.9K | 24.7K | 10.6K |
| AMZN | PUT | SWEEP | BULLISH | 01/16/26 | $10.65 | $10.5 | $10.56 | $205.00 | $52.8K | 6.7K | 3 |
| AMZN | CALL | TRADE | BULLISH | 09/19/25 | $2.43 | $2.41 | $2.43 | $230.00 | $51.7K | 16.8K | 13 |
| AMZN | CALL | SWEEP | BULLISH | 08/15/25 | $4.8 | $4.7 | $4.8 | $212.50 | $48.0K | 3.0K | 98 |
About Amazon.com
Amazon is the leading online retailer and marketplace for third party sellers. Retail related revenue represents approximately 75% of total, followed by Amazon Web Services' cloud computing, storage, database, and other offerings (15%), advertising services (5% to 10%), and other the remainder. International segments constitute 25% to 30% of Amazon's non-AWS sales, led by Germany, the United Kingdom, and Japan.
In light of the recent options history for Amazon.com, it's now appropriate to focus on the company itself. We aim to explore its current performance.
Where Is Amazon.com Standing Right Now?
- Trading volume stands at 3,519,537, with AMZN's price up by 0.12%, positioned at $214.01.
- RSI indicators show the stock to be is currently neutral between overbought and oversold.
- Earnings announcement expected in 85 days.
What The Experts Say On Amazon.com
A total of 5 professional analysts have given their take on this stock in the last 30 days, setting an average price target of $258.0.
Turn $1000 into $1270 in just 20 days?
20-year pro options trader reveals his one-line chart technique that shows when to buy and sell. Copy his trades, which have had averaged a 27% profit every 20 days. Click here for access.
* Maintaining their stance, an analyst from Canaccord Genuity continues to hold a Buy rating for Amazon.com, targeting a price of $280.
* Maintaining their stance, an analyst from Telsey Advisory Group continues to hold a Outperform rating for Amazon.com, targeting a price of $235.
* An analyst from Wells Fargo persists with their Equal-Weight rating on Amazon.com, maintaining a target price of $245.
* Reflecting concerns, an analyst from WestPark Capital lowers its rating to Buy with a new price target of $280.
* In a cautious move, an analyst from Wedbush downgraded its rating to Outperform, setting a price target of $250.
Options trading presents higher risks and potential rewards. Astute traders manage these risks by continually educating themselves, adapting their strategies, monitoring multiple indicators, and keeping a close eye on market movements. Stay informed about the latest Amazon.com options trades with real-time alerts from Benzinga Pro.