Natural Gas Update: Market in Balance, Risks at the Edges
This analysis was conducted in cooperation with Anastasia Volkova, analyst of LSE.
Natural gas prices remain broadly stable, with summer 2025 contracts slightly above median pre-expiry levels and within normal volatility ranges. However, winter 2026–27 contracts continue to trade above the upper quartile, reflecting longer-term supply and weather risks. While the 3-year segment of the forward curve is flattening, distortions persist in both near- and long-term tenors compared to 2020–2024. On the fundamentals side, storage injections are projected at +36 BCF for early July, keeping inventory levels above the five-year median. Weather patterns are stabilizing nationally, though regional heat spikes are expected in key demand centers.
Current prices vs. price spread 10 days before expiry by month since 2010
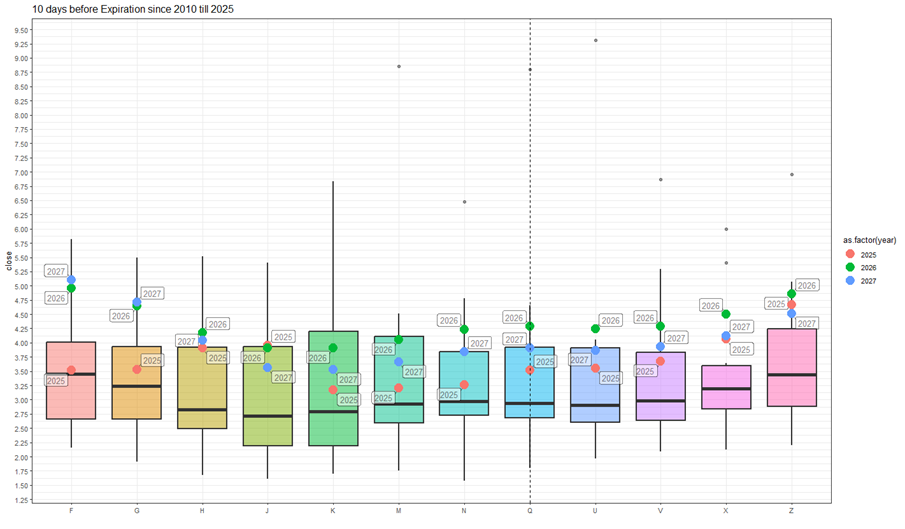
The price situation has not changed significantly compared to the previous week. Summer 2025 contracts are trading slightly above the median values on the expiration date, while remaining within the interquartile range. The 2026 and 2027 winter contracts continue to trade above the upper quartile. A gradual stabilization of prices is expected.
Forward curve compared with 2020-2024
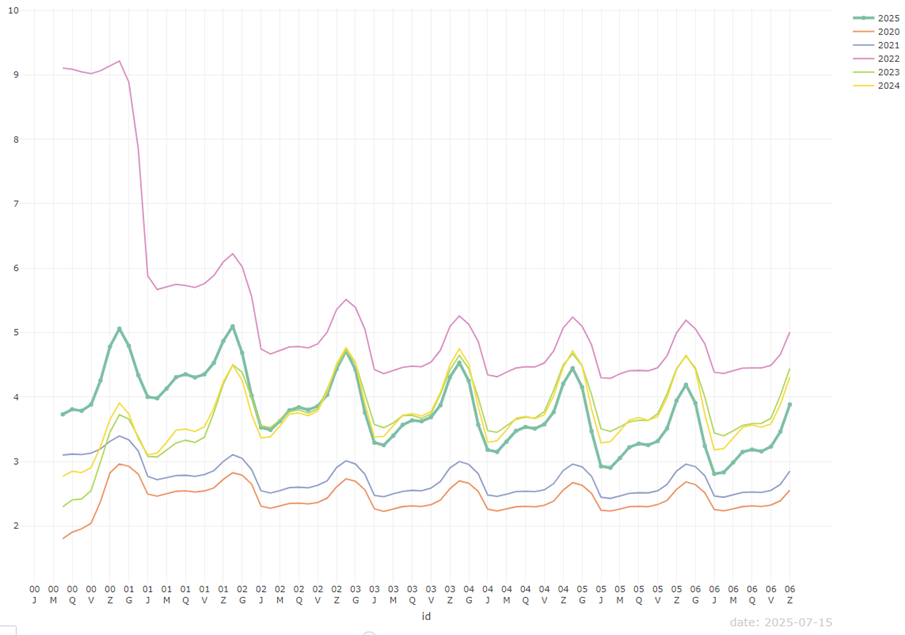
Despite the fact that the gas prices of 2025 contracts with delivery in three years approached the levels of similar contracts in 2023 and 2024, in the segments with near-term (1-2 years) and distant (5-6 years) deliveries a pronounced skewness of the forward curve remains.
Current gas inventory and forecast for next week compared to 2019-2024
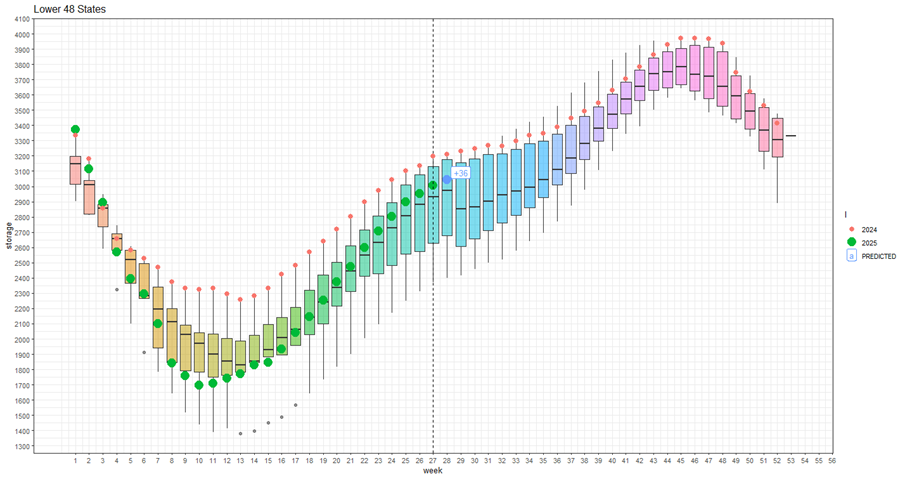
For the 28th week (July 04-10) we expect a 36 BCF increase in storage. Fill rate is above the median for the previous 5 years. Injection rates have slowed down a bit after last week’s growth, but if the current supply and demand situation persists, the peak level of 2024 is possible. The weather and seasonal phenomena of the second half of summer remain a constraint.
Weekly HDD+CDD total from current NOAA data and forecast for the next two weeks comparing 1994-2024
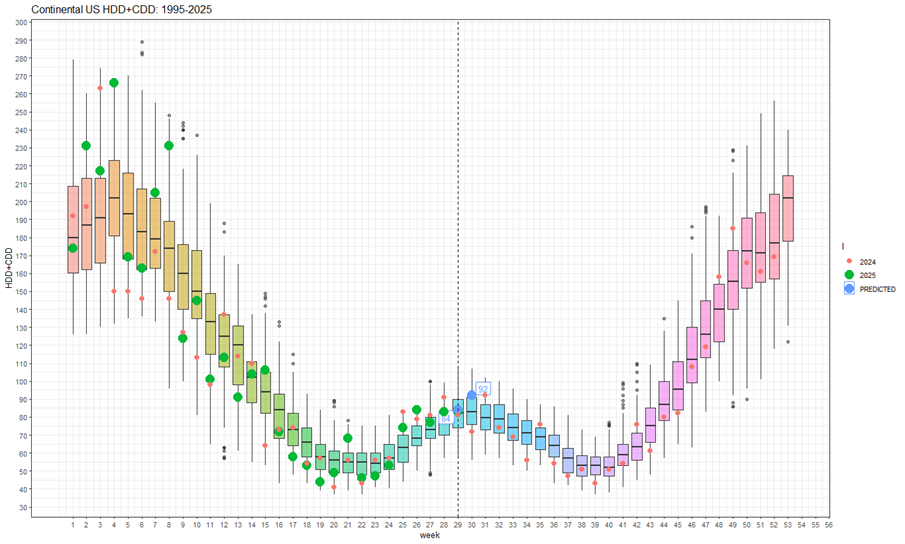
In the current week 29, the weather has stabilized and reached the 30-year median. Next week (30) is forecast to be hotter than the median, but HDD+CDD values are not outside the interquartile range
Explanation of the chart: in candlesticks quantiles for 30 years from 1994 to 2024. Red dots 2024, green 2025, blue prediction 2025
Weekly HDD+CDD total from current NOAA data and forecast for the next two weeks compared to 1994-2024 by region
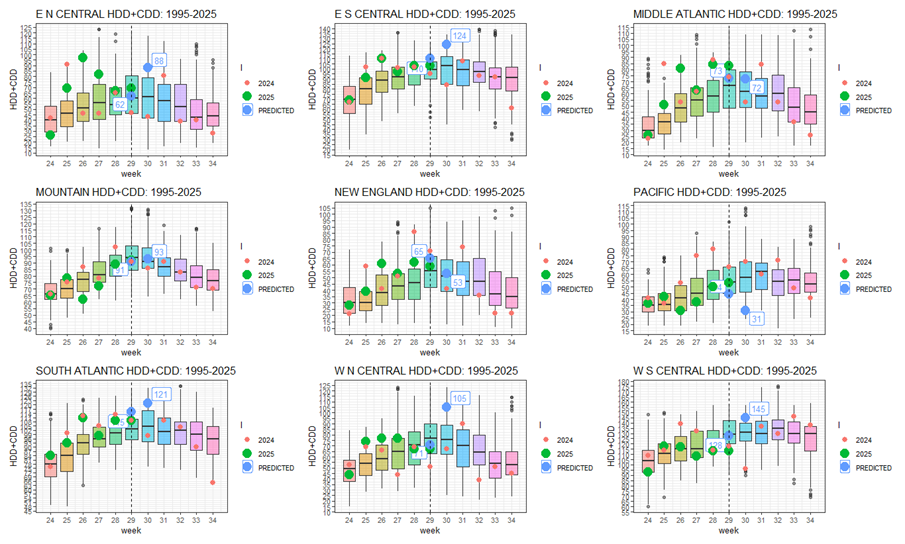
Looking regionally, we see strong HDD+CDD increases in the next 30 weeks above the top quartile in EN Central, ES Central, Southc Atlantic, WN Central, WS Central regions
Weekly cumulative supply/demand difference compared to 2014-2024
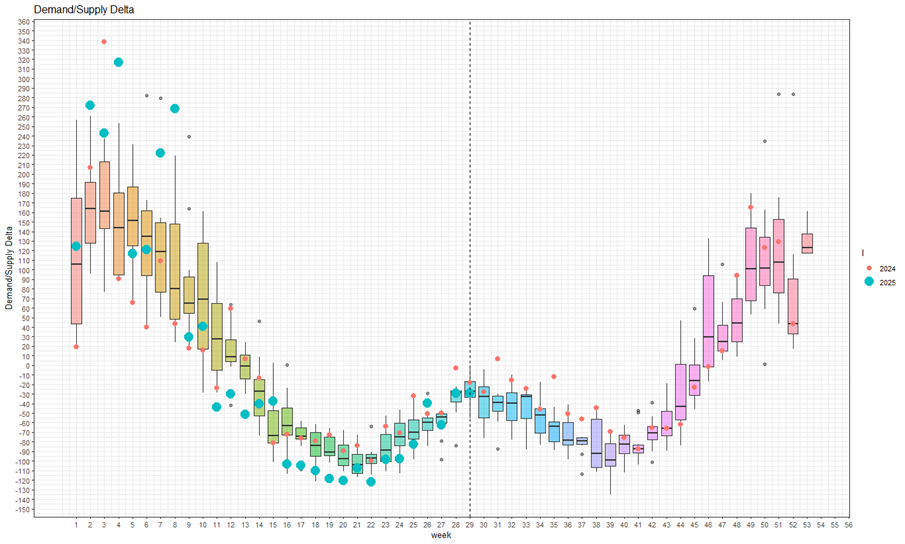
In the current 29th week, the constituent factors of the supply-demand differential have reached the median.
Analysis of the past week is here.
Benzinga Disclaimer: This article is from an unpaid external contributor. It does not represent Benzinga’s reporting and has not been edited for content or accuracy.
Posted-In: contributors Expert IdeasCommodities Opinion