LNG: Supply-Demand Differential Dropped Below Median

This LNG analysis was prepared by Dr. Igor Isaev in cooperation with Anastasia Volkova, LSE analyst.
Current LNG prices compared to price dispersion 10 days before expiration by month since 2010
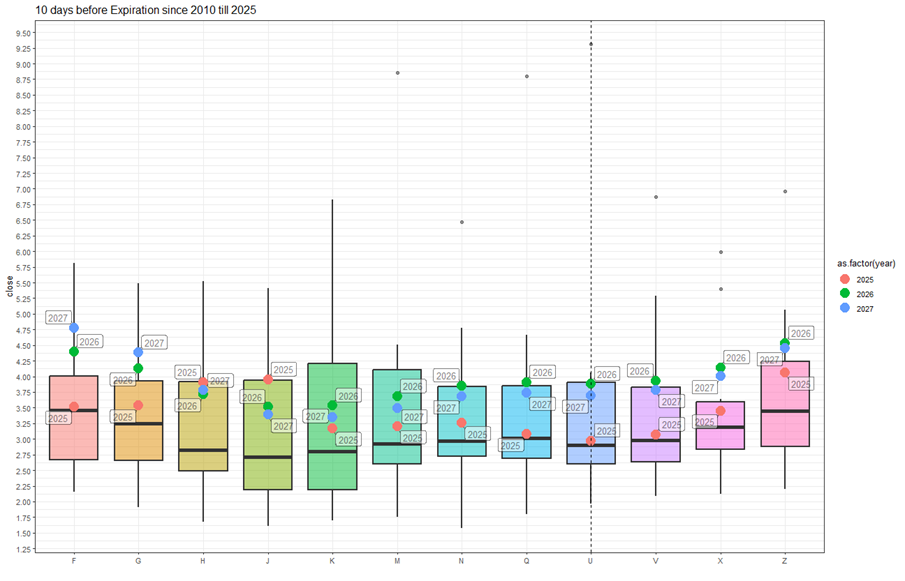
The U contract is trading at the average price 10 days before expiration for all expired contracts over the previous 15 years. Prices for the 2025 autumn contracts are trading even closer to the median values on the expiration date, while remaining within the interquartile range. Prices for the 2026 and 2027 winter contracts are falling but have not yet broken through the upper quartile values.
Forward curve compared to 2020-2024
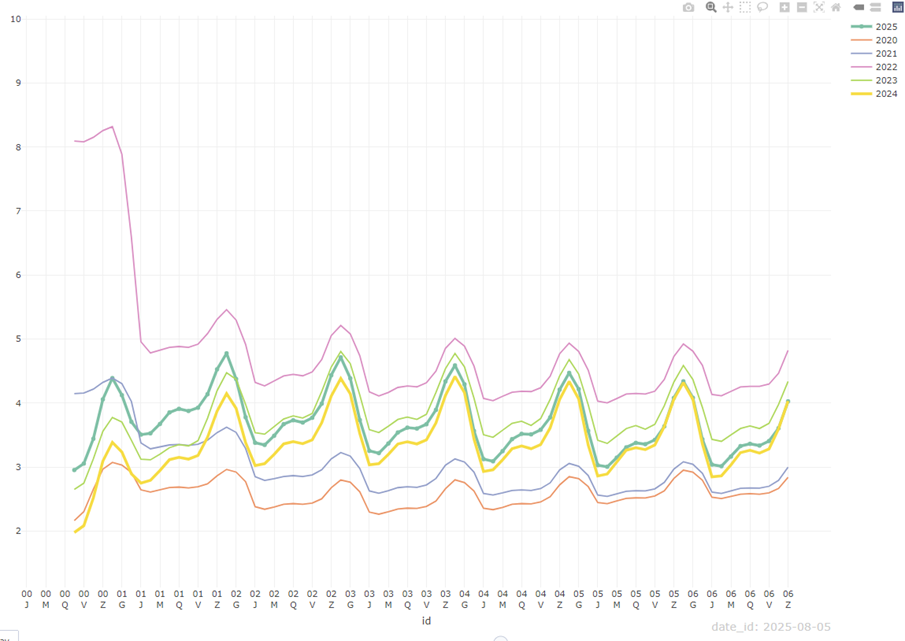
Despite the fact that prices for 2025 contracts with delivery in three years have approached the levels of similar contracts for 2023 and 2024, there remains a pronounced skew in the forward curve in segments with the nearest (1–2 years) and most distant (5–6 years) deliveries.
Current LNG stocks and forecast for next week compared to 2019-2024
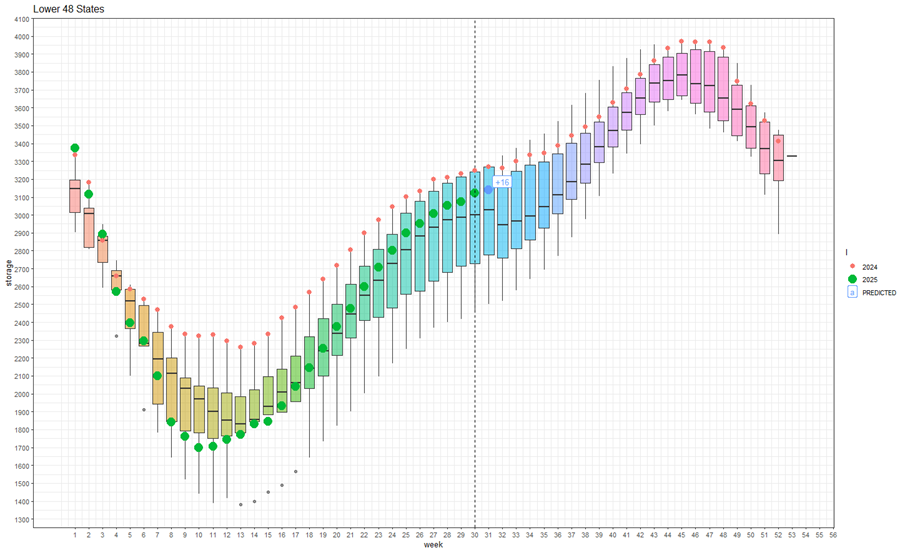
For week 31 (July 28–August 3), we expect an increase in storage of +16 BCF. The fill rate remains firmly above the median for the previous five years. Injection rates are maintaining positive momentum. If the current supply and demand conditions remain unchanged, peak levels seen in 2024 are possible. Weather and seasonal phenomena in late summer and early fall remain a limiting factor.
Weekly HDD+CDD total based on current NOAA data and forecast for the next two weeks compared to 1994-2024
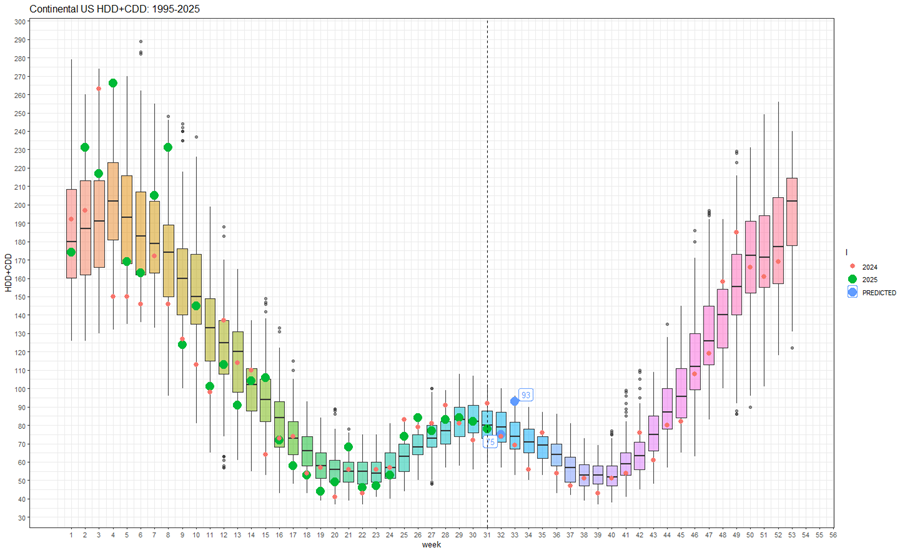
At the current 32nd week, the weather remains at average levels based on observations over the past 30 years. Despite the fact that the seasonal peak of HDD+CDD has practically passed, next week (33rd) is expected to see HDD+CDD values significantly above average.
Explanation of the graph: the candles represent quantiles for 30 years from 1994 to 2024. Red dots represent 2024, green dots represent 2025, and blue dots represent the 2025 forecast.
Weekly HDD+CDD total based on current NOAA data and forecast for the next two weeks compared to 1994-2024 by region
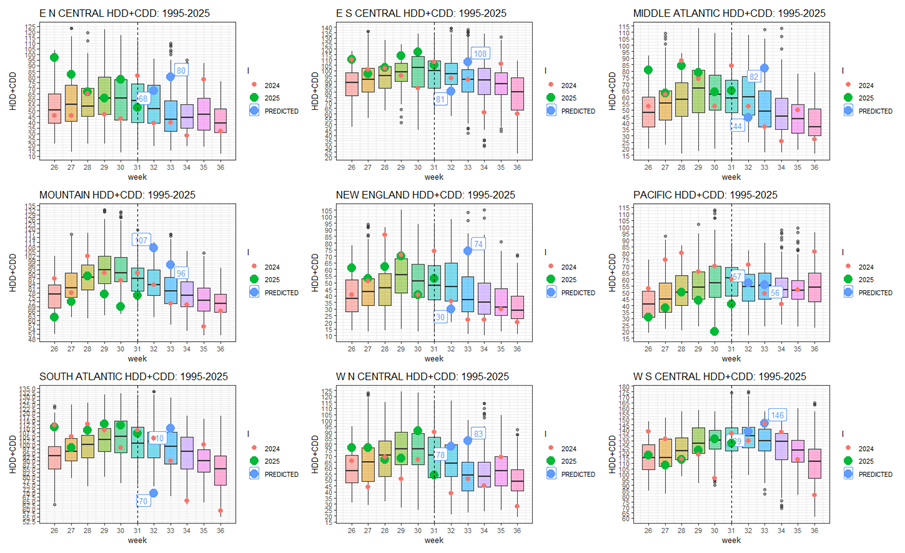
Looking at the regional breakdown, we see an increased level of HDD+CDD in week 33 in virtually all regions.
Weekly total difference between supply and demand compared to 2014-2024
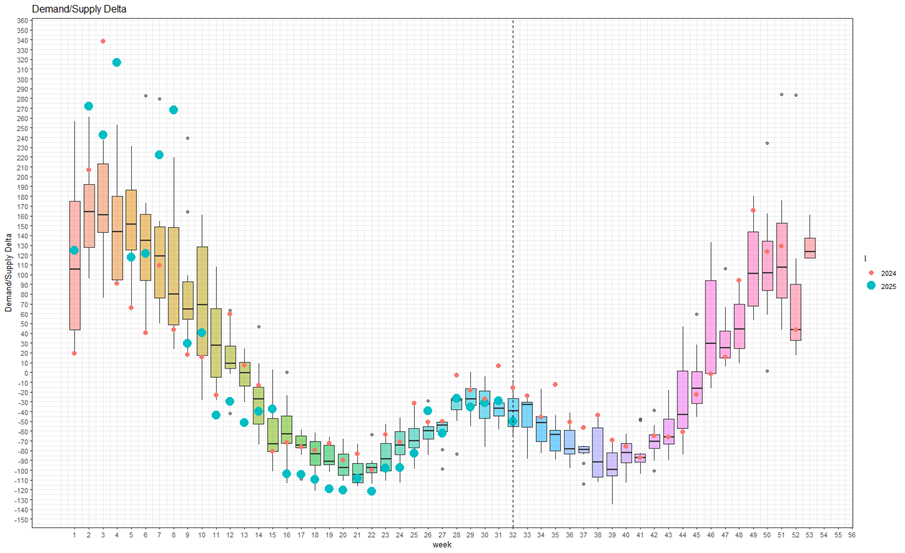
In the current 32nd week, the difference between supply and demand of LNG fell below the median, almost to the lower interquartile range. On the demand side, we are seeing a sharp decline in consumption for power generation and a recovery in LNG exports. On the supply side, production continues to grow, but imports from Canada have fallen.
Benzinga Disclaimer: This article is from an unpaid external contributor. It does not represent Benzinga’s reporting and has not been edited for content or accuracy.
Posted-In: contributorsCommodities Opinion Markets Trading Ideas