What If You Invested In S&P 500 Excluding Mag 7? Here's How NVDA, AMZN, AAPL And Others Have Performed In The Last Year

The S&P 500 index growth sans the Magnificent 7 stocks is almost negligible over the last 10 years, as the market capitalization of these stocks dominates the index.
What Happened: According to a Goldman Sachs graph shared by the Markets & Mayhem, the Magnificent 7 stocks have driven the S&P 500 growth since 2014, with their index rising from 500 to over 3500.
While the remaining 493 stocks stagnated near 500, reflecting a 2024 study by Goldman Sachs showing the stocks accounted for over 30% of the S&P 500’s market cap.
This concentration aligns with the Pareto principle, where 20% of assets drive 80% of returns, supported by a 2018 ScienceDirect study on stock market indices that found power-law distributions in extreme variations, suggesting the Magnificent 7’s dominance is a natural outcome of market-cap weighting rather than an anomaly.
Thus, according to this graph, if an investor invested in the S&P 500, excluding the Magnificent 7 stocks, they’d have virtually negligible returns.
Filip Felician Dames, the founder of a venture capital fund, Cherry Ventures, explained that the research and development, or R&D spending, by Magnificent 7 stocks was a significant determinant of the company’s “future earnings power.”
“We need more innovation and risk-taking mentality,” he added.
Meanwhile, looking at the valuation of these seven firms using the price-to-sales ratio, Amazon.com Inc. was the cheapest at 0.38, while Microsoft Corp. was the most expensive at 0.92.
Why It Matters: Comparatively, the Magnificent 7 stocks haven’t performed well in 2025. Only Nvidia Corp., Microsoft, and Meta Platforms Inc. beat the -1.33% year-to-date return of the Roundhill Magnificent Seven ETF (BATS:MAGS) and the 1.91% return of the S&P 500 index.
Stocks
YTD Performance
One-Year Performance
Nvidia Corporation (NASDAQ:NVDA)
5.18%
11.24%
Apple Inc. (NASDAQ:AAPL)
-19.38%
-6.25%
Microsoft Corp. (NASDAQ:MSFT)
14.73%
7.75%
Amazon.com Inc. (NASDAQ:AMZN)
-3.50%
14.20%
Alphabet Inc. (NASDAQ:GOOG)
-8.73%
-2.10%
Meta Platforms Inc. (NASDAQ:META)
16.11%
38.68%
Tesla Inc. (NASDAQ:TSLA)
-15.09%
77.37%
According to Benzinga Pro, the SPDR S&P 500 ETF Trust (NYSE:SPY) was trading above its short and long-term simple dialing moving averages with a relative strength index at 57.35, which was in a neutral zone.
Despite the largely bullish chart, its momentum indicator was reflecting a key bearish crossover signal as its MACD line of 7.1 was below the signal line of 8.3 with a negative histogram value of 1.2.
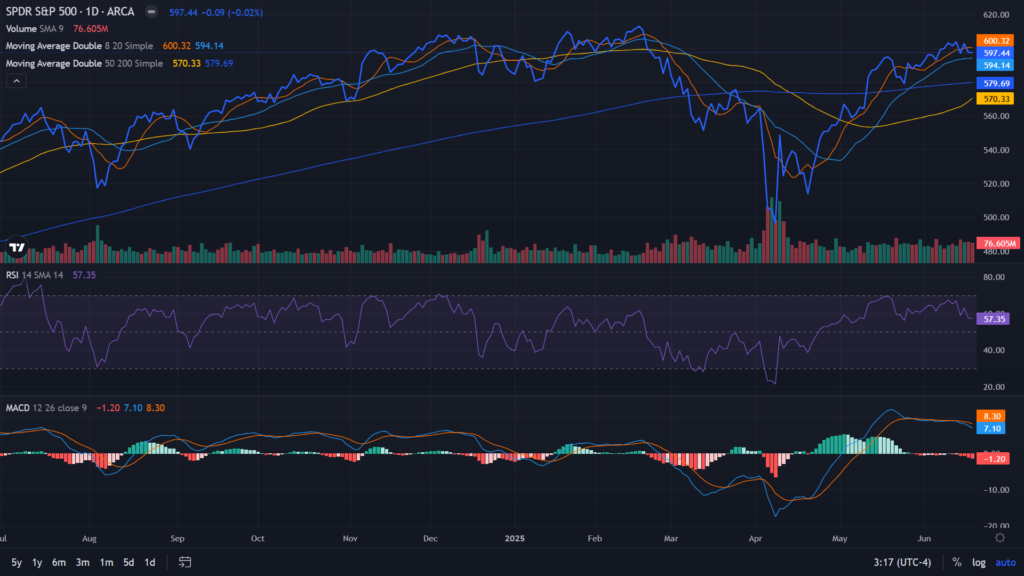
Price Action: The SPY and Invesco QQQ Trust ETF (NASDAQ:QQQ), which track the S&P 500 index and Nasdaq 100 index, respectively, declined slightly on Wednesday. The SPY was down 0.015% at $597.44, while the QQQ was 0.017% lower at $528.99, according to Benzinga Pro data.
On Friday, the futures of the S&P 500, Dow Jones, and the Nasdaq 100 indices were trading lower.
Read Next:
Photo courtesy: Jack Hong / Shutterstock.com
© 2025 Benzinga.com. Benzinga does not provide investment advice. All rights reserved.
Posted-In: AI big tech Filip Felician Dames Goldman Sachs Mag 7 magnificent 7 Pareto principleEquities