Nuclear Stocks Get A Boost From Trump's Plan; New Data Revives Specter Of Stagflation, AMD Fails Whisper Test
To gain an edge, this is what you need to know today.
Extreme Positive Sentiment Amid Stagflation Specter
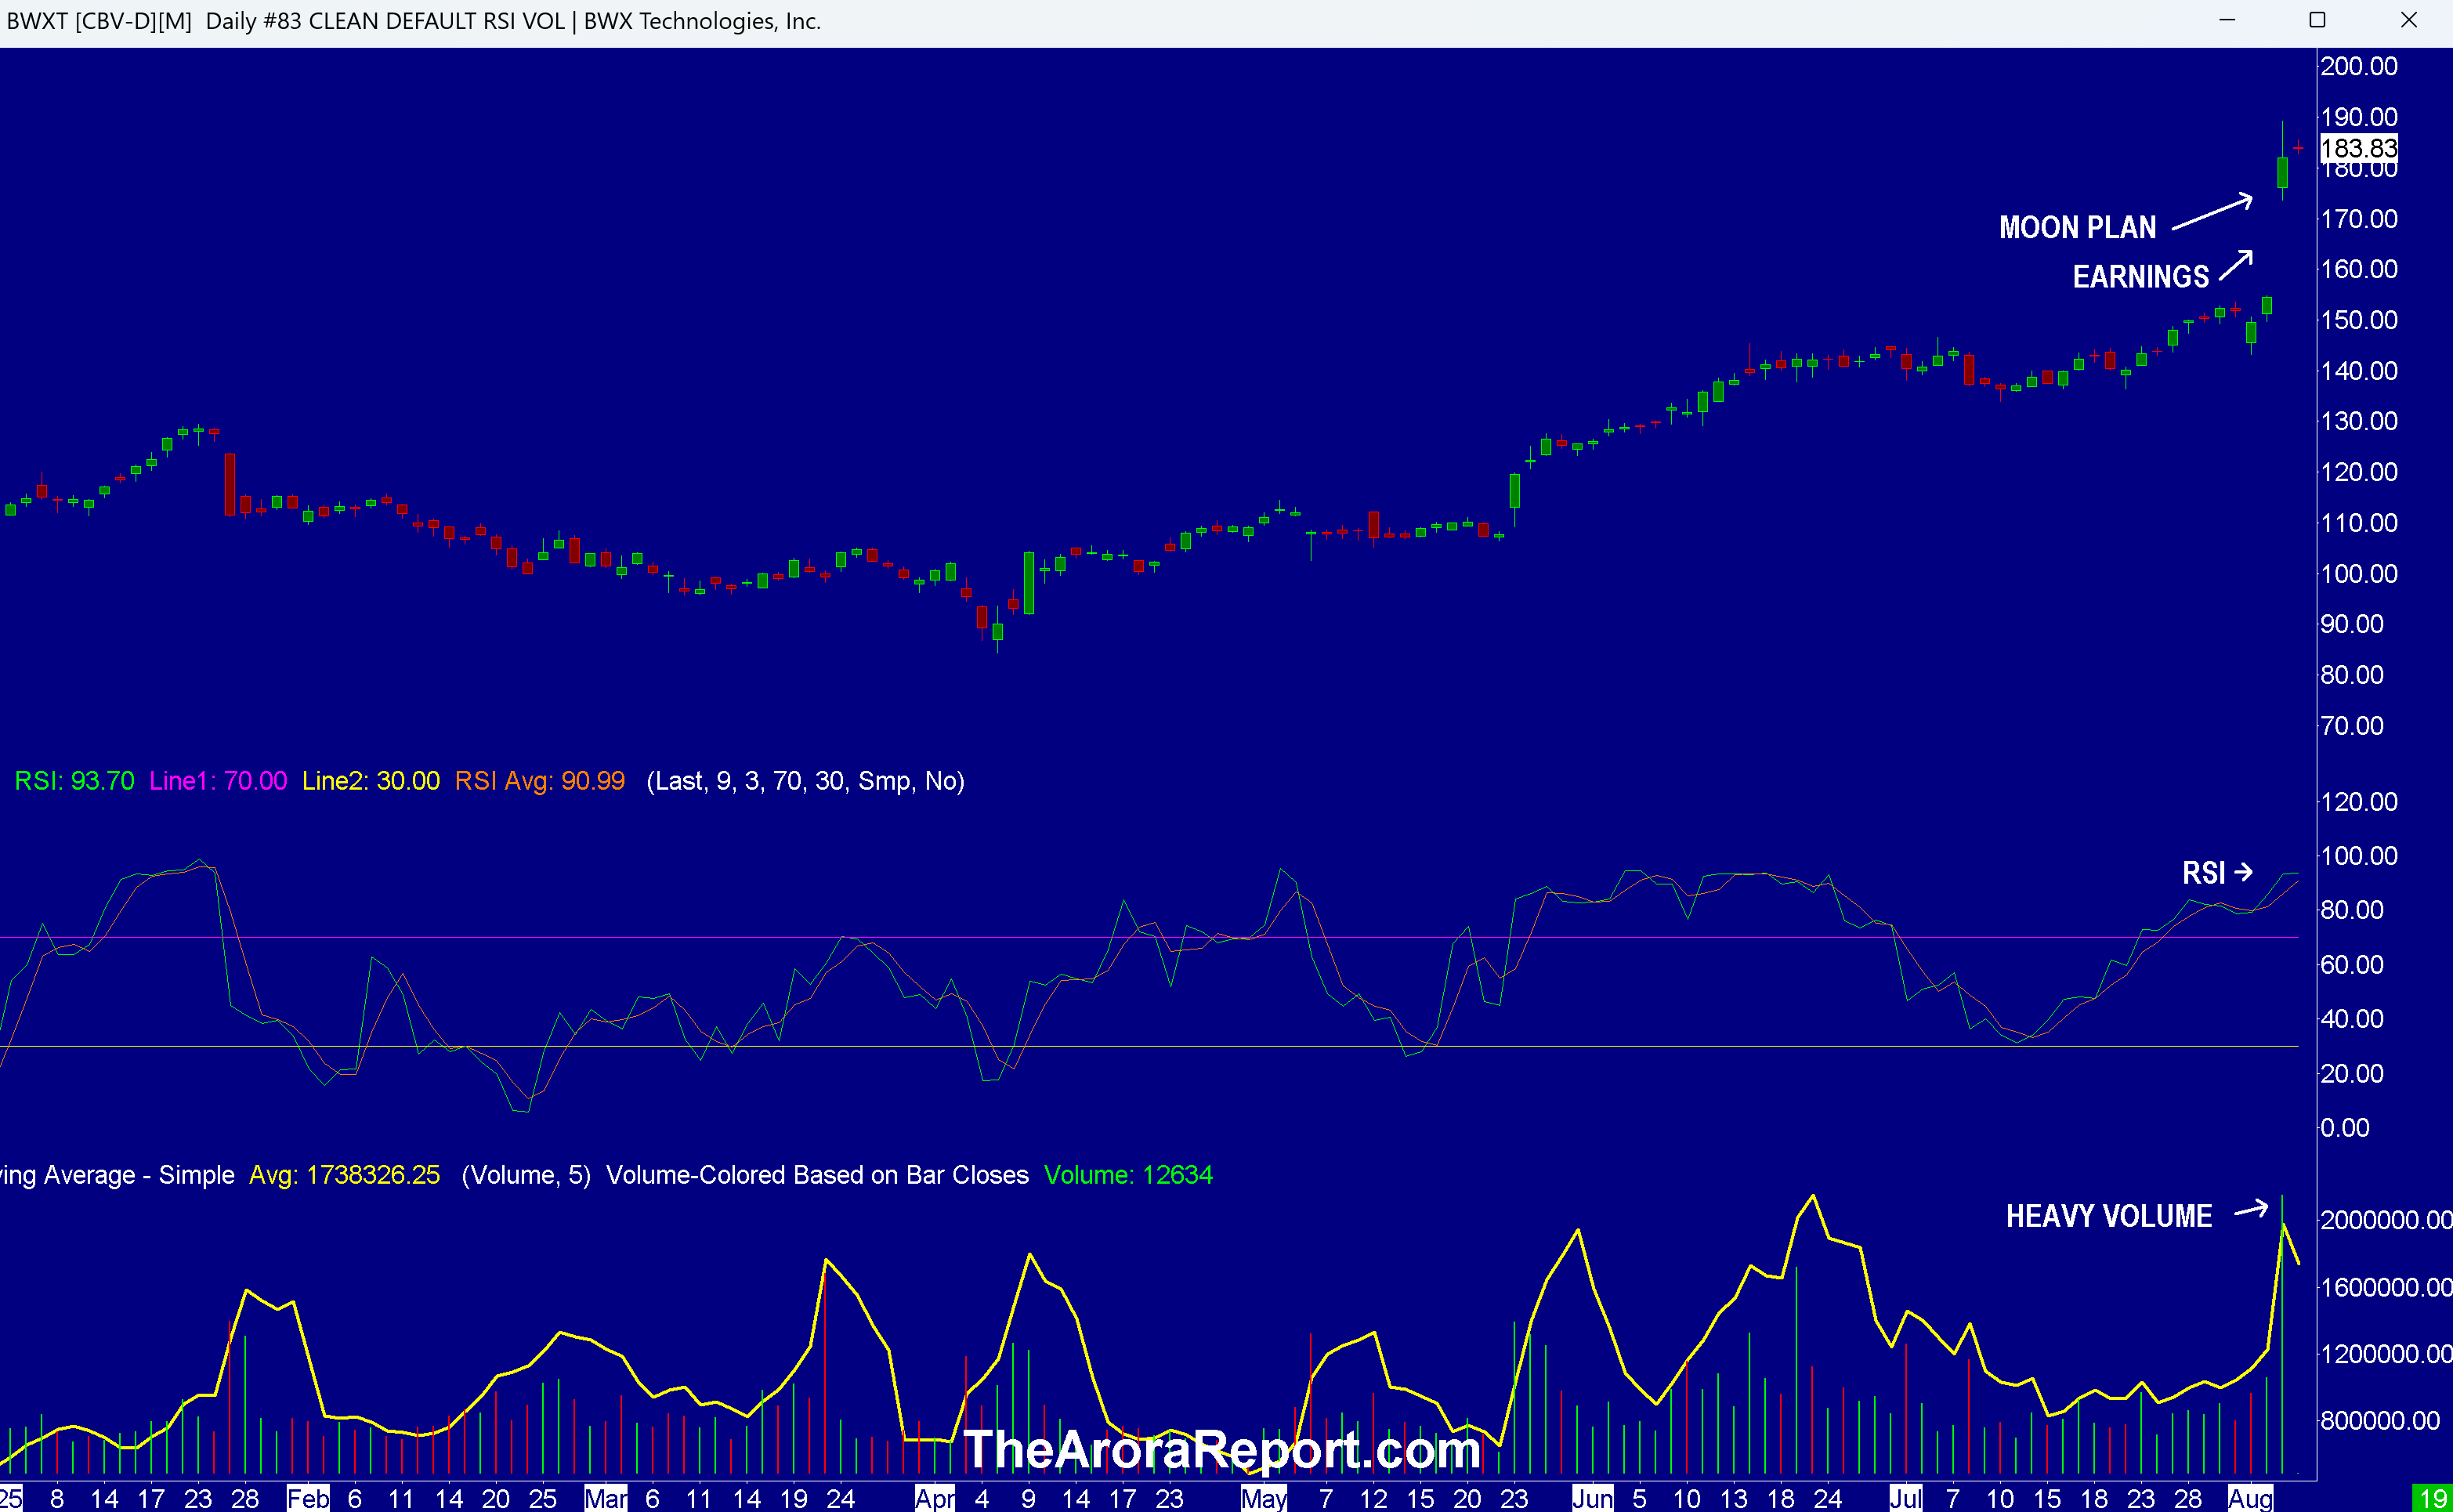
This is the chart of BWX Technologies Inc (NYSE:BWXT).
Note the following:
- This article is about the big picture, not an individual stock. The chart of BWXT is being used to illustrate the point.
- The chart shows a gap up in BWXT stock. As full disclosure, BWX Technologies (BWXT) is one of the 12 nuclear stocks on our list. The gap up in BWXT stock was triggered by strong earnings and a potential Trump plan to put a nuclear reactor on the moon by 2030.
- The chart shows heavy volume on the gap up. This indicates conviction.
- RSI on the chart shows that BWXT stock is overbought. Overbought stocks are susceptible to a pullback.
- BWXT was spun off from Babcock and Wilcox. BWXT supplies nuclear reactors to the U.S. Navy. If President Trump follows through and spends money building a nuclear reactor on the moon, BWXT will likely be the main beneficiary.
- Bullishness from the potential plan to build a reactor on the moon has brought in extremely aggressive buying in other nuclear stocks such as Oklo Inc (OKLO), Nuscale Power Corp (SMR), Centrus Energy Corp (LEU), and Nano Nuclear Energy Inc (NNE).
- In our analysis, prudent investors should note that the potential plan to build a nuclear reactor on the moon is adding to the already extremely positive sentiment in the stock market.
- From a market sentiment perspective, Advanced Micro Devices Inc (AMD) is a very important stock. AMD is also a favorite of the momo crowd. AMD reported very strong earnings. However, AMD failed to meet the whisper test. AMD earnings and projections are below the whisper numbers. Whisper numbers are the numbers analysts privately share with their best clients. Whisper numbers are often different from consensus numbers published by the same analysts for public consumption. Analysts typically provide whisper numbers only to their best clients, and not the public. The stock has fallen about 6% as of this writing in the premarket.
- In order to stop China from replacing the U.S. as the world's superpower, over the last decade, the U.S. has been working very hard to align with India. India is the world's largest democracy. In a potential long term strategic blunder, President Trump appears to be pushing India away from the U.S. and close to China. India buys about one third of Russian oil exports, and China buys about one half of Russian oil exports. President Trump appears to be close to a deal with China with no concern about China importing Russian oil. However, President Trump is threatening to impose very large tariffs on India, in addition to the 25% tariff already announced, for importing Russian oil. India is responding by saying Prime Minister Modi will likely visit China and attend the Shanghai Cooperation Organization Summit. The summit will be held August 31 to September 1. Modi has not visited China since 2019. In our analysis, if the U.S. strategic blunder comes to pass, this will have a long term impact for investors – creating new perils and opportunities.
- A test is ahead for the markets when the U.S. Treasury auctions $42B of 10-year notes. If the auction is good, expect buying to come into the stock market. On the other hand, if the auction is poor, at least in theory, the stock market should fall.
- As we shared with you yesterday, the ISM Services release was market moving. Here are the details:
- ISM Services data came at 50.1% vs. 51.5% consensus. A number under 50 indicates economic contraction.
- The prices subindex came at 69.9.
- The employment subindex came at 46.4.
- In our analysis, ISM Services data has reawakened the specter of stagflation.
- Among important earnings, McDonald’s Corp (MCD) and Shopify Inc (SHOP) reported earnings better than consensus and whisper numbers. Walt Disney Co (DIS), Uber Technologies Inc (UBER), and Amgen Inc (AMGN) reported earnings less than whisper numbers. Also of special note are earnings from AI server assembler Super Micro Computer Inc (SMCI). SMCI stock is a favorite of the momo crowd. Going into earnings, the momo crowd had run up SMCI on hopium. After trading as high as $59.40 yesterday, SMCI stock is trading at $47.54 as of this writing in the premarket. Super Micro Computer’s earnings show that the momo crowd's hopium was unjustified.
Magnificent Seven Money Flows
In the early trade, money flows are positive in Apple Inc (AAPL), Amazon.com, Inc. (AMZN), Microsoft Corp (MSFT), and Meta Platforms Inc (META).
In the early trade, money flows are neutral in Alphabet Inc Class C (GOOG).
In the early trade, money flows are negative in NVIDIA Corp (NVDA) and Tesla Inc (TSLA).
In the early trade, money flows are positive in SPDR S&P 500 ETF Trust (SPY) and Invesco QQQ Trust Series 1 (QQQ).
Momo Crowd And Smart Money In Stocks
Investors can gain an edge by knowing money flows in SPY and QQQ. Investors can get a bigger edge by knowing when smart money is buying stocks, gold, and oil. The most popular ETF for gold is SPDR Gold Trust (GLD). The most popular ETF for silver is iShares Silver Trust (SLV). The most popular ETF for oil is United States Oil ETF (USO).
Oil
API crude inventories came at a draw of 4.2M barrels vs. a consensus of a draw of 1.8M barrels. This data is bearish, but buying is coming into oil on potential Trump steps against Russia.
Bitcoin
Bitcoin is range bound.
What To Do Now
Consider a protection band consisting of cash or Treasury bills or short-term tactical trades as well as short to medium term hedges and short term hedges. This is a good way to protect yourself and participate in the upside at the same time.
You can determine your protection bands by adding cash to hedges. The high band of the protection is appropriate for those who are older or conservative. The low band of the protection is appropriate for those who are younger or aggressive. If you do not hedge, the total cash level should be more than stated above but significantly less than cash plus hedges.
A protection band of 0% would be very bullish and would indicate full investment with 0% in cash. A protection band of 100% would be very bearish and would indicate a need for aggressive protection with cash and hedges or aggressive short selling.
It is worth reminding that you cannot take advantage of new upcoming opportunities if you are not holding enough cash. When adjusting hedge levels, consider adjusting partial stop quantities for stock positions (non ETF); consider using wider stops on remaining quantities and also allowing more room for high beta stocks. High beta stocks are the ones that move more than the market.
Traditional 60/40 Portfolio
Probability based risk reward adjusted for inflation does not favor long duration strategic bond allocation at this time.
Those who want to stick to traditional 60% allocation to stocks and 40% to bonds may consider focusing on only high quality bonds and bonds of five year duration or less. Those willing to bring sophistication to their investing may consider using bond ETFs as tactical positions and not strategic positions at this time.
Benzinga Disclaimer: This article is from an unpaid external contributor. It does not represent Benzinga’s reporting and has not been edited for content or accuracy.
Posted-In: contributors Expert IdeasEquities Market Summary Global Opinion Markets Trading Ideas