Dollar Index - Pattern Is Increasingly Looking Like A Bottom
The Dollar Index (DXY) witnessed a strong rebound from the 50-day MA yesterday, strengthening the appeal of what looks increasingly likely a bottom. The index closed above 94.00 level yesterday and is currently struggling to hold above the psychological level.
Daily chart
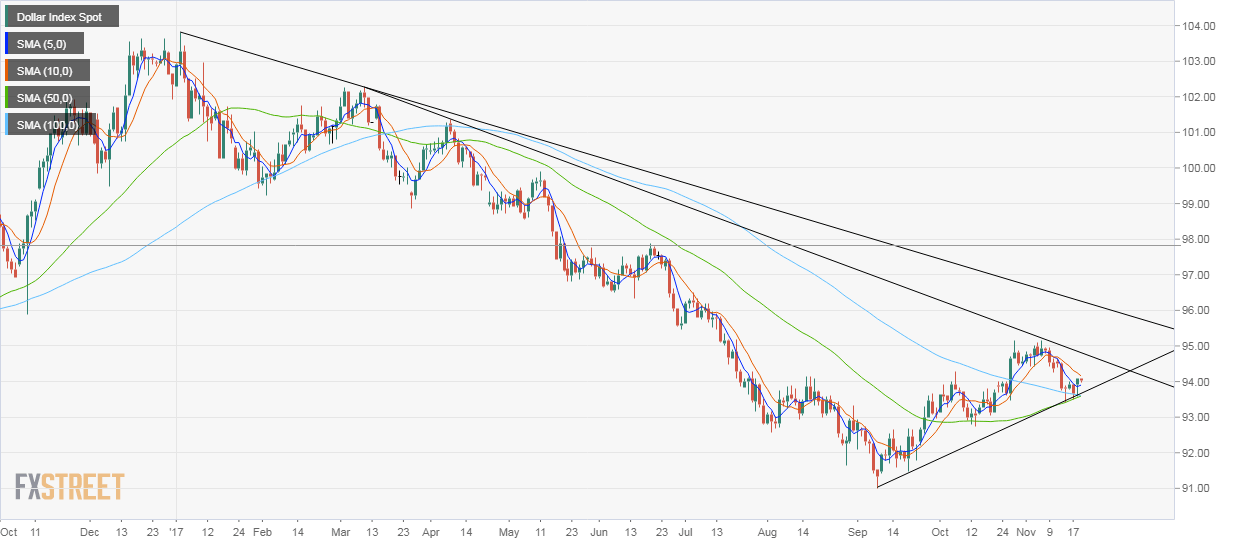
Last Wednesday's long-legged doji candle rightfully indicated that the decline from the Nov. 7 high of 95.15 has run out of steam. In the subsequent days, the dips to the 50-day MA and the 100-day MA have been short-lived.
Also, the 50-day MA and the 100-day MA are converging in a USD bullish manner. The 5-day MA and the 10-day MA have shed bearish bias as well. Further, the index continues to defend the ascending trendline.
Still, I would like to see a move above 94.67 (trendline sloping lower from Mar. 9 high and Apr. 10 high) to confirm a rally to 96.00 (trendline sloping lower from Jan. 3 high and Mar. 9 high).
Bearish scenario - Only an end of the day close below 93.40 would abort the bullish view.
This article was submitted by an external contributor and may not represent the views and opinions of Benzinga.
© 2025 Benzinga.com. Benzinga does not provide investment advice. All rights reserved.
Posted-In: FXStreet FXstreet.comForex Markets