Options Corner: Use Science To Take Advantage Of Walmart's Mispriced Derivatives

Retail traders, especially those engaging an ultra-high-profile name like Walmart Inc (NYSE:WMT), must contend with a harsh reality: you will always be slower than the institutional players. Still, accepting this reality leads to clarity. By not wasting your time and energy trying to find an edge where it does not and cannot exist, you can focus on realistic solutions. Essentially, we're going to play a different game by slowing it down.
Sure, the emphasis on Wall Street is about speed. We've been hearing about high-frequency trading and more recently, using artificial intelligence to find hidden opportunities. The issue with attempting to play the speed game is that, from a retail perspective, you're always going to start off on the back foot.
For instance, throughout this year, one of the biggest concerns about WMT stock has been the trade policies of President Donald Trump. With the administration indelicately imposing tariffs on key economic partners, the move crimps Walmart's global supply chain, forcing the company to either eat the cost or pass it to consumers. Notably, WMT has gained about 5% on a year-to-date basis, conspicuously lower than the S&P 500's gain of around 7% during the same period.
On the other hand, Walmart — along with other retail-centered names like Peloton Interactive Inc (NASDAQ:PTON) and Chewy Inc (NYSE:CHWY) — have been demonstrating their moxie by going after e-commerce juggernaut Amazon.com Inc (NASDAQ:AMZN). In short, Amazon's decision to extend its Prime Day promotion this year has opened an opportunity for competitors to steal market share.
These are interesting elements but here's the point from a trader's perspective: they've already been baked into the share price.
That's not to say that there isn't an edge that can be exploited. But first, we must define the null hypothesis or the assumption in this case that there is no mispricing in WMT stock. If so, the chance that a long position in WMT will be profitable on any given week (from January 2019) is 57.02%.
An options thesis must have a credible way of beating 57.02%. Otherwise, what are we even doing here?
Pinpointing A Strategy For WMT Stock Using Real Analysis
In practically any domain, the null hypothesis is foundational to analytical rigor. A clear example comes from the biotech industry. The null hypothesis is that the underlying therapeutic has no effect. Therefore, scientists and the medical community only act if the data rejects the null; that is, the drug has a real, measurable effect. It should be the same philosophy in finance.
Unfortunately, I'm not smart enough to look at all the blips and bloops of WMT stock and decipher repeatable patterns. Peruse a typical technical analysis chart: you have support lines here, Fibonacci retracement levels there, MACD and RSI doing some squiggly stuff. And then, the financial research industry wants to put even more stuff on an already busy chart.
Allow me to drop a truth bomb: if your song sucks, adding more reverb isn't going to make it better.
No, we're going to slow this game down by modifying the principles forwarded by Russian mathematician Andrei Andreevich Markov. Essentially, we will discretize all the chaos of price action into market breadth or sequences of accumulative and distributive sessions. By compressing share price into root demand, we can then answer the core question: at the end of the session, was the market a net buyer or net seller?
By categorizing all price action — no matter the magnitude of performance — into up weeks or down weeks, we can distinguish various behavioral states. Further, by the examination of past analogs, we can better determine the probability of kinesis among these different states.
Conducting the above compression for WMT stock across rolling 10-week intervals (since January 2019) gives us the following demand profile:
L10 Category
Sample Size
Up Probability
Baseline Probability
Median Return if Up
2-8-D
2
100.00%
56.89%
1.60%
3-7-D
10
80.00%
56.89%
2.25%
4-6-D
27
62.96%
56.89%
1.99%
4-6-U
13
61.54%
56.89%
2.02%
5-5-D
43
55.81%
56.89%
1.60%
5-5-U
36
58.33%
56.89%
1.15%
6-4-D
17
76.47%
56.89%
1.00%
6-4-U
74
59.46%
56.89%
1.72%
7-3-D
5
40.00%
56.89%
3.55%
7-3-U
60
50.00%
56.89%
1.53%
8-2-U
18
38.89%
56.89%
2.30%
9-1-U
3
33.33%
56.89%
1.93%
In the trailing two months, WMT stock is printing a "6-4-D" sequence: six up weeks, four down weeks, with a negative trajectory across the 10-week period. It's a relatively rare sequence, having only materialized 17 times. What makes it unusual is that, even though the balance of accumulative sessions outweighs distributive, the trajectory is negative.
Still, the takeaway here is that in 76.47% of cases, the following week's price action results in upside, with a median return of 1%. Should the bulls maintain control of the market for the next three weeks, a push toward the $97 level is on the cards.
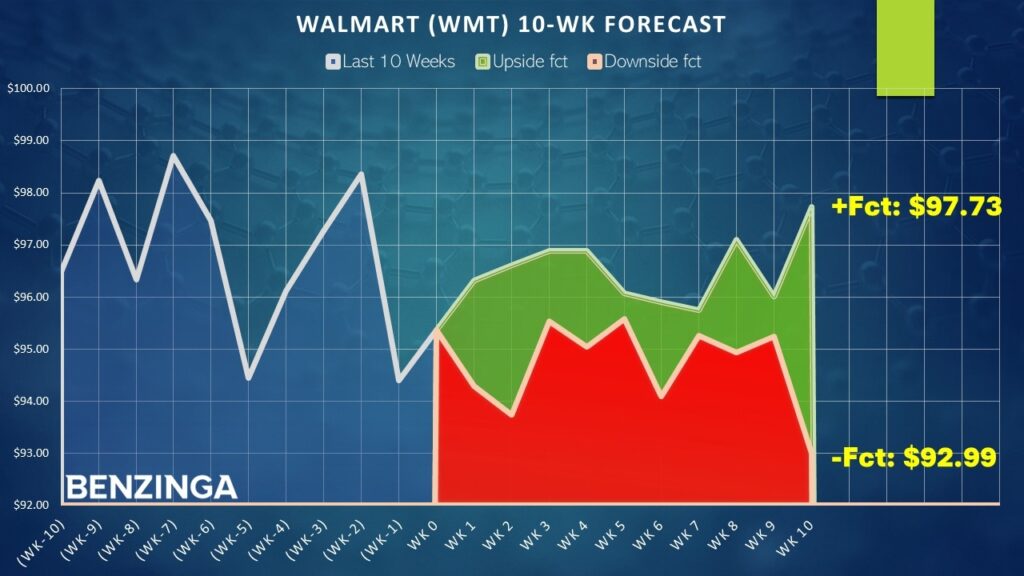
From a trader's perspective, that's what we're going to look for: an upside range between $96.50 to $97 over the next three to four weeks. This is our asymmetric edge, our alternative hypothesis that there may indeed be a (favorable) mispricing in WMT stock.
Using Math To Guide Our Trading
Based on the market intelligence above, there are two ideas to consider. One is the 95/96 bull call spread expiring Aug. 1. This transaction involves buying the $95 call and simultaneously selling the $96 call, for a net debit paid of $53 (the most that can be lost in the trade). Should WMT stock rise through the short strike price ($96) at expiration, the maximum reward is $47, a payout of nearly 89%.
Those traders who want to stretch for a greater reward may consider the 96/97 bull spread expiring Aug. 8. This trade requires a net debit of $47 but if the short strike is triggered at expiration, the maximum reward is $53, a payout of 113%.
The thing about WMT stock is that the 6-4-D quantitative sequence is empirically intriguing. Running a one-tailed binomial test on the sequence reveals a p-value of 8.19%. This means that there's only an 8.19% chance that WMT will rise 76.47% of the time randomly rather than as a "consequence" of the 6-4-D.
Scientifically, a p-value of 8.19% is too high to be considered statistically significant. However, in the context of the stock market's open system, this is about as significant as you're going to get. At the very least, WMT stock deserves close attention over the next few weeks.
The opinions and views expressed in this content are those of the individual author and do not necessarily reflect the views of Benzinga. Benzinga is not responsible for the accuracy or reliability of any information provided herein. This content is for informational purposes only and should not be misconstrued as investment advice or a recommendation to buy or sell any security. Readers are asked not to rely on the opinions or information herein, and encouraged to do their own due diligence before making investing decisions.
Read More:
Photo: Shutterstock
© 2025 Benzinga.com. Benzinga does not provide investment advice. All rights reserved.
Posted-In: Expert Ideas Options Trade of the Day Stories That MatterEquities Options