Options Corner: Visa Is Setting Up A Statistical Breakout That You Don't Want To Miss

Multinational payment card services provider Visa (NYSE:V) continues to perform as a consistently reliable blue-chip enterprise. On a year-to-date basis, V stock has gained just over 10%, which is a modest but noticeable improvement over the benchmark S&P 500 index. At the same time, broader economic concerns cloud the company, which is set to release its results for the fiscal third quarter near month's end. Still, the unusual circumstances may present a bullish edge for speculators.
On July 29, Visa is scheduled to disclose its financial results, with Wall Street analysts anticipating earnings per share of $2.83 on revenue of $9.82 billion. In the year-ago quarter, the financial services giant posted earnings of $2.42 per share with a top-line print of $8.9 billion. What should boost confidence for investors is that Visa commands a long history of earnings beats.
That said, it's also interesting that the sole hiccup since the fiscal third quarter of 2020 materialized one year ago, when Visa suffered a slight miss against revenue expectations. Could lightning strike twice for the bears?
It's possible and the pessimists might argue that it's probable. Consumers have been pivoting toward lower-cost food alternatives, a dynamic that echoes the 2009 recession. Unfortunately for the company, broader headwinds have impacted its revenue streams, suggesting that Visa is vulnerable to economic softness — despite the counterargument that credit cards can allow holders to stretch their finances.
Nevertheless, the broader transition toward digital payment solutions has so far bolstered V stock. While there are consumers that still prefer to use cash, the emphasis today is on greater convenience and wider integration with digital platforms. Overall, the idea is that this massive tailwind can help Visa ride out the present economic turbulence.
Establishing The Benchmark For V Stock And Beating It
While the financial services provider has performed well this year, V stock has admittedly encountered a downdraft. Since June 11, the security has struggled within a bearish trend channel, raising legitimate questions about its forward trajectory. Still, the consolidation may be signaling for a possible reversal.
First, it's important to establish a baseline for V stock, which would be its null hypothesis: the expected performance of the security assuming no mispricing. Since January 2019, the chance that a one-week long position in Visa stock will be profitable is 56.43%. Therefore, an alternative hypothesis must be able to beat this benchmark.
In this case, our alternative hypothesis is that because V stock is printing a rare quantitative signal, the probability of upside is 78.57%.
To arrive at the above conclusion, you cannot simply look at the share price and make such a determination. Instead, we can discretize price action into market breadth, essentially converting it into sequences of accumulative and distributive sessions. In this manner, we're dealing with root demand; that is, at the end of the session, was the market a net buyer or net seller?
By compressing price discovery into simple up weeks and down weeks, we can more easily identify recurring patterns — and more importantly, the likelihood of transition from one sequence to another. Conducting this exercise for Visa stock across 10-week intervals gives us the following demand profile:
L10 Category
Sample Size
Up Probability
Baseline Probability
Median Return if Up
2-8-D
6
50.00%
56.30%
2.04%
3-7-D
20
55.00%
56.30%
3.29%
3-7-U
4
50.00%
56.30%
1.70%
4-6-D
38
47.37%
56.30%
3.37%
4-6-U
14
64.29%
56.30%
1.26%
5-5-D
32
50.00%
56.30%
2.80%
5-5-U
39
61.54%
56.30%
1.91%
6-4-D
13
76.92%
56.30%
1.69%
6-4-U
61
54.10%
56.30%
1.33%
7-3-U
61
55.74%
56.30%
1.43%
8-2-U
26
57.69%
56.30%
1.47%
9-1-U
5
20.00%
56.30%
4.96%
In the trailing two months, V stock is printing a "6-4-D" sequence: four up weeks, six down weeks, with a negative trajectory across the 10-week period. It's a rare sequence, having materialized only 14 times since January 2019. However, the takeaway, again, is that in 76.92% of cases, the following week's price action results in upside, with a median return of 1.69%.
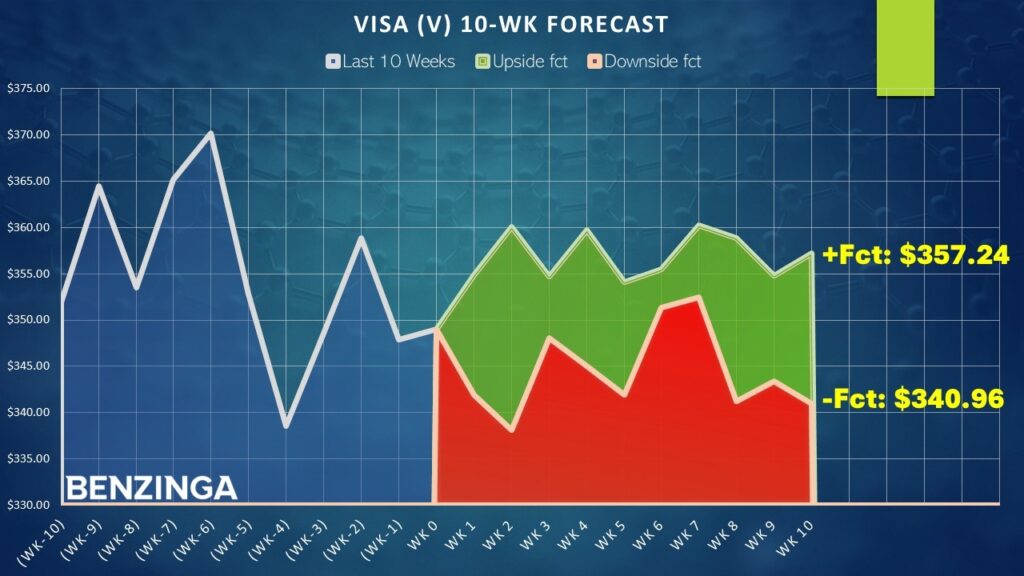
Assuming that V stock closes around $349, bullish speculators may anticipate a quick push to $354.90, possibly to $355 given the psychological importance. From here, if the bulls maintain control over the next four weeks, a push toward $361 is reasonable based on an analysis of past analogs.
Taking A Shot On Visa
Armed with the market intelligence above, there are two ways to play V stock. First, you may consider the 352.50/355 bull call spread expiring Aug. 1. This transaction involves buying the $352.50 call and simultaneously selling the $355 call, for a net debit paid of $125 (the most that can be lost in the trade). Should V rise through the short strike price ($355) at expiration, the maximum reward is also $125, a 100% payout.
With the above trade, you have the option of pulling out ahead of earnings if conditions justify it or wait till after the earnings disclosure.
Another idea to consider is the 355/360 bull spread expiring Aug. 15. This transaction requires a net debit of $215 at time of writing. However, if Visa stock manages to rise through the short strike price at expiration, the maximum reward is $285, a payout of roughly 133%.
Of course, the above trade hinges on the viability of the 6-4-D sequence and its projected statistical response. Running a one-tailed binomial test reveals a p-value of 7.76. This means that there's a 7.76% probability that V stock can rise 76.92% on a frequency basis by random chance rather than as a "consequence" of the 6-4-D sequence.
Scientifically, this does not meet the threshold of statistical significance, where the p-value cutoff is 5%. However, given the open-system nature of the stock market, this is unquestionably an empirically unusual quant signal — one that could provide an edge for adventurous speculators.
The opinions and views expressed in this content are those of the individual author and do not necessarily reflect the views of Benzinga. Benzinga is not responsible for the accuracy or reliability of any information provided herein. This content is for informational purposes only and should not be misconstrued as investment advice or a recommendation to buy or sell any security. Readers are asked not to rely on the opinions or information herein, and encouraged to do their own due diligence before making investing decisions.
Read More:
Photo: Shutterstock
© 2025 Benzinga.com. Benzinga does not provide investment advice. All rights reserved.
Posted-In: Expert Ideas Options Trade of the Day Stories That MatterEarnings Equities Long Ideas Options