Alibaba Slides, But Holds This Bullish Pattern: How To Trade It

Alibaba Group Holdings Ltd - ADR (NYSE: BABA) was trading more than 7% lower on Thursday, compared to the S&P 500 which was trading less than 1% lower.
The heavily beaten-down stock has suffered due to China’s continued crackdown on its domestic technology sector and on Wednesday, bankers and stakeholders behind Jack Ma’s Ant Group made the decision to delay the Alibaba-affiliated IPO indefinitely.
On Tuesday, Alibaba dipped briefly below a key support zone at $96.17, which put the stock in danger closing the trading session at a level Alibaba hasn’t closed below since Jan. 20, 2017. On Wednesday, Alibaba gapped down below the key level, which puts the stock in danger of having a heavy resistance area overhead.
See Also: Alibaba's NFT Marketplace Suspends Users Over 'Massage Gun' Purchases
The Alibaba Chart: On Feb. 17, Alibaba entered into a downtrend and has printed a consistent series of lower highs and lower lows. The most recent lower high was created on Wednesday at the $100.97 level and the most recent lower low may be forming on Thursday.
Alibaba is also trading in a falling channel pattern on the daily chart. On Thursday, the stock tested the lower descending trendline of the pattern as support and bounced. A falling channel is considered to be bearish until the stock breaches the upper trendline, which can signal a strong reversal to the upside is on the way.
Alibaba’s relative strength index (RSI) indicates at least a bounce up to the top of the channel may be in the cards, because it is measuring in at about 29%. When a stock’s RSI reaches or falls below the 30% level it becomes oversold, which can be a buy signal for technical traders.
Alibaba has multiple gaps above on the chart and because gaps fill about 90% of the time, it’s likely the stock will trade up to fill the ranges in the future. The closest gap exists between $95.70 and $97.50 and above that range there is another gap between $115.40 and $117.20.
Alibaba is trading well below the eight-day and 21-day exponential moving averages (EMAs), with the eight-day EMA trending below the 21-day. When stock becomes extended from the eight-day EMA, it is likely to reverse course or consolidate sideways to allow the EMA to catch up to the share price.
Want direct analysis? Find me in the BZ Pro lounge! Click here for a free trial.
- Bulls want to see big bullish volume come in and break Alibaba up from the falling channel pattern, which will cause the stock to regain support at the eight-day EMA. Alibaba has resistance above at $96.17 and $104.44.
- Bears want to see Alibaba continue to trade down within the falling channel pattern, or for big bearish volume to come in and break the stock down from the channel on higher-than-average volume. There is support below $89.95 and $83.84.
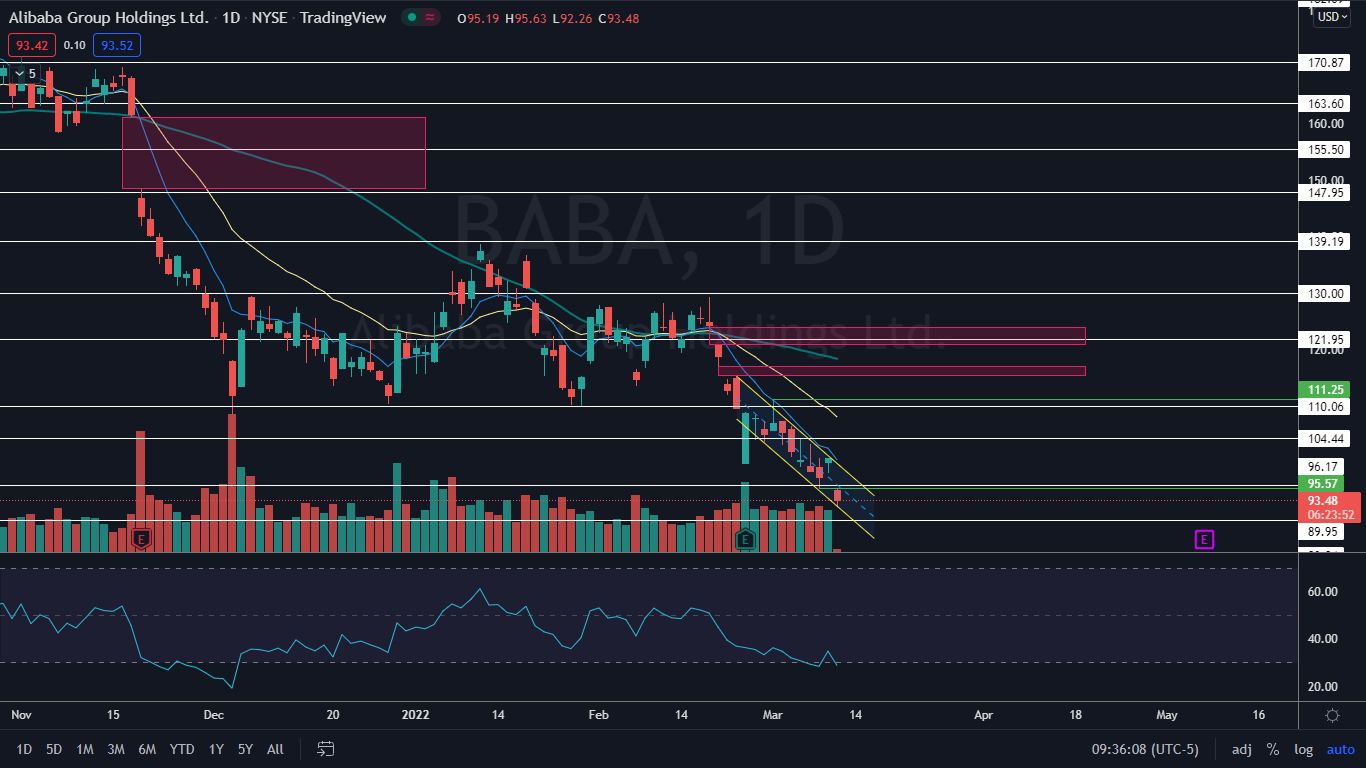
Photo: Courtesy Alibaba
© 2025 Benzinga.com. Benzinga does not provide investment advice. All rights reserved.
Posted-In: Ant Group China Jack MaNews Technicals Global Movers Trading Ideas Best of Benzinga