EUR/USD Could Extend Its Slump On A Break Below 1.1815, A Fibonacci Support Level

The following post was written and/or published as a collaboration between Benzinga’s in-house sponsored content team and a financial partner of Benzinga.
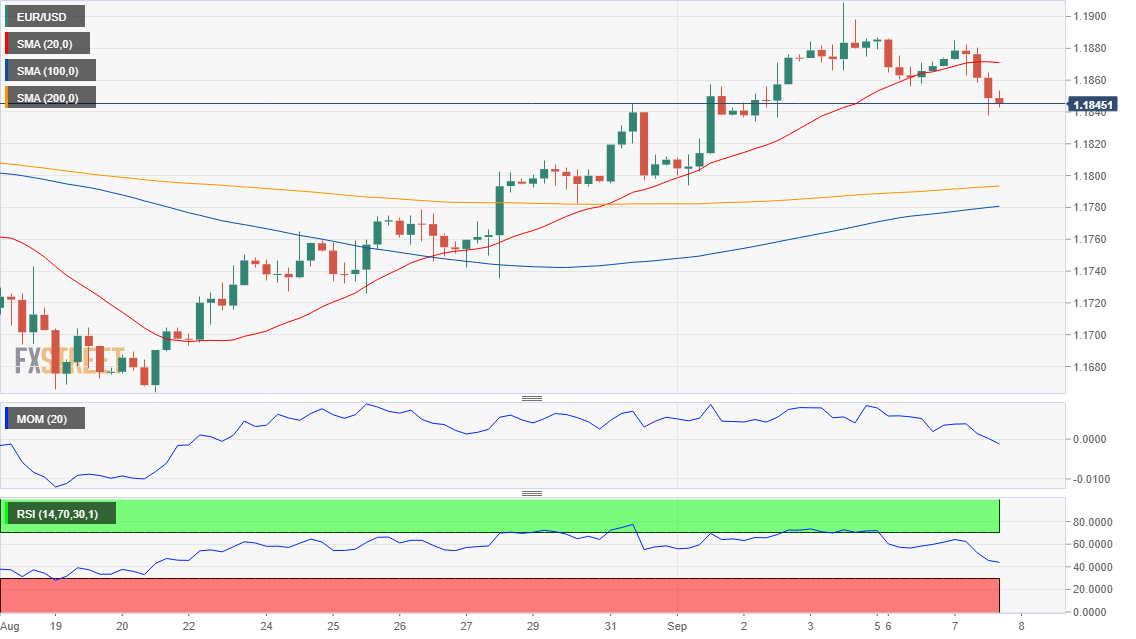
EUR/USD Current price: 1.1845
- A scarce economic calendar and mounting growth concerns undermined risk appetite.
- The dollar’s corrective advance could turn into a bullish run if yields keep rising.
- EUR/USD could extend its slump on a break below 1.1815, a Fibonacci support level.
The EUR/USD pair edged lower for a second consecutive day, ending Tuesday in the 1.1840 price zone. The dollar gathered momentum as the day went by, amid investors moving away from high-yielding assets. Equities were down in Europe and the US, although the NASDAQ Composite managed to post a modest advance. US Treasury yields provide support to the greenback, despite the sour tone of equities, with the yield on the 10-year note hitting an intraday high of 1.385% and currently trading at around 1.36%.
European data released earlier in the day was mixed. Germany published the September ZEW Survey, which showed that Economic Sentiment in the country contracted to 26.5, while for the whole Union, it resulted at 31.1, both missing the market’s expectations. On the other hand, EU Gross Domestic Product was upwardly revised to 2.2% QoQ from 2%, beating expectations. On Wednesday, the macroeconomic calendar will be scarce, as the EU won’t publish relevant data while the US will release minor reports.
EUR/USD short-term technical outlook
The EUR/USD pair has broken below the 23.6% retracement of its latest daily run between 1.1663 and 1.1908 at 1.1850, now the immediate resistance level. The 38.2% retracement of the same rally stands at 1.1815, and only below it, the pair could turn bearish.
The 4-hour chart shows that bears are not over. The pair has broken below its 20 SMA, which turned flat. The longer moving averages are still below the current level, losing their bullish strength. Meanwhile, the Momentum indicator heads firmly lower within negative levels as the RSI indicator consolidates at around 46. As said, 1.1815 is the level to watch now, ahead of the 1.1770 price zone.
Support levels: 1.1815 1.1770 1.1725
Resistance levels: 1.1865 1.1910 1.1950
Image by Bruno /Germany from Pixabay
The preceding post was written and/or published as a collaboration between Benzinga’s in-house sponsored content team and a financial partner of Benzinga. Although the piece is not and should not be construed as editorial content, the sponsored content team works to ensure that any and all information contained within is true and accurate to the best of their knowledge and research. This content is for informational purposes only and not intended to be investing advice.
This article was submitted by an external contributor and may not represent the views and opinions of Benzinga.
© 2025 Benzinga.com. Benzinga does not provide investment advice. All rights reserved.
Posted-In: EUR FXStreetEarnings News Eurozone Global Markets General