What Microsoft And Meta's Best Earnings In Recent Memory Mean For The AI Trade
To gain an edge, this is what you need to know today.
AI Trade
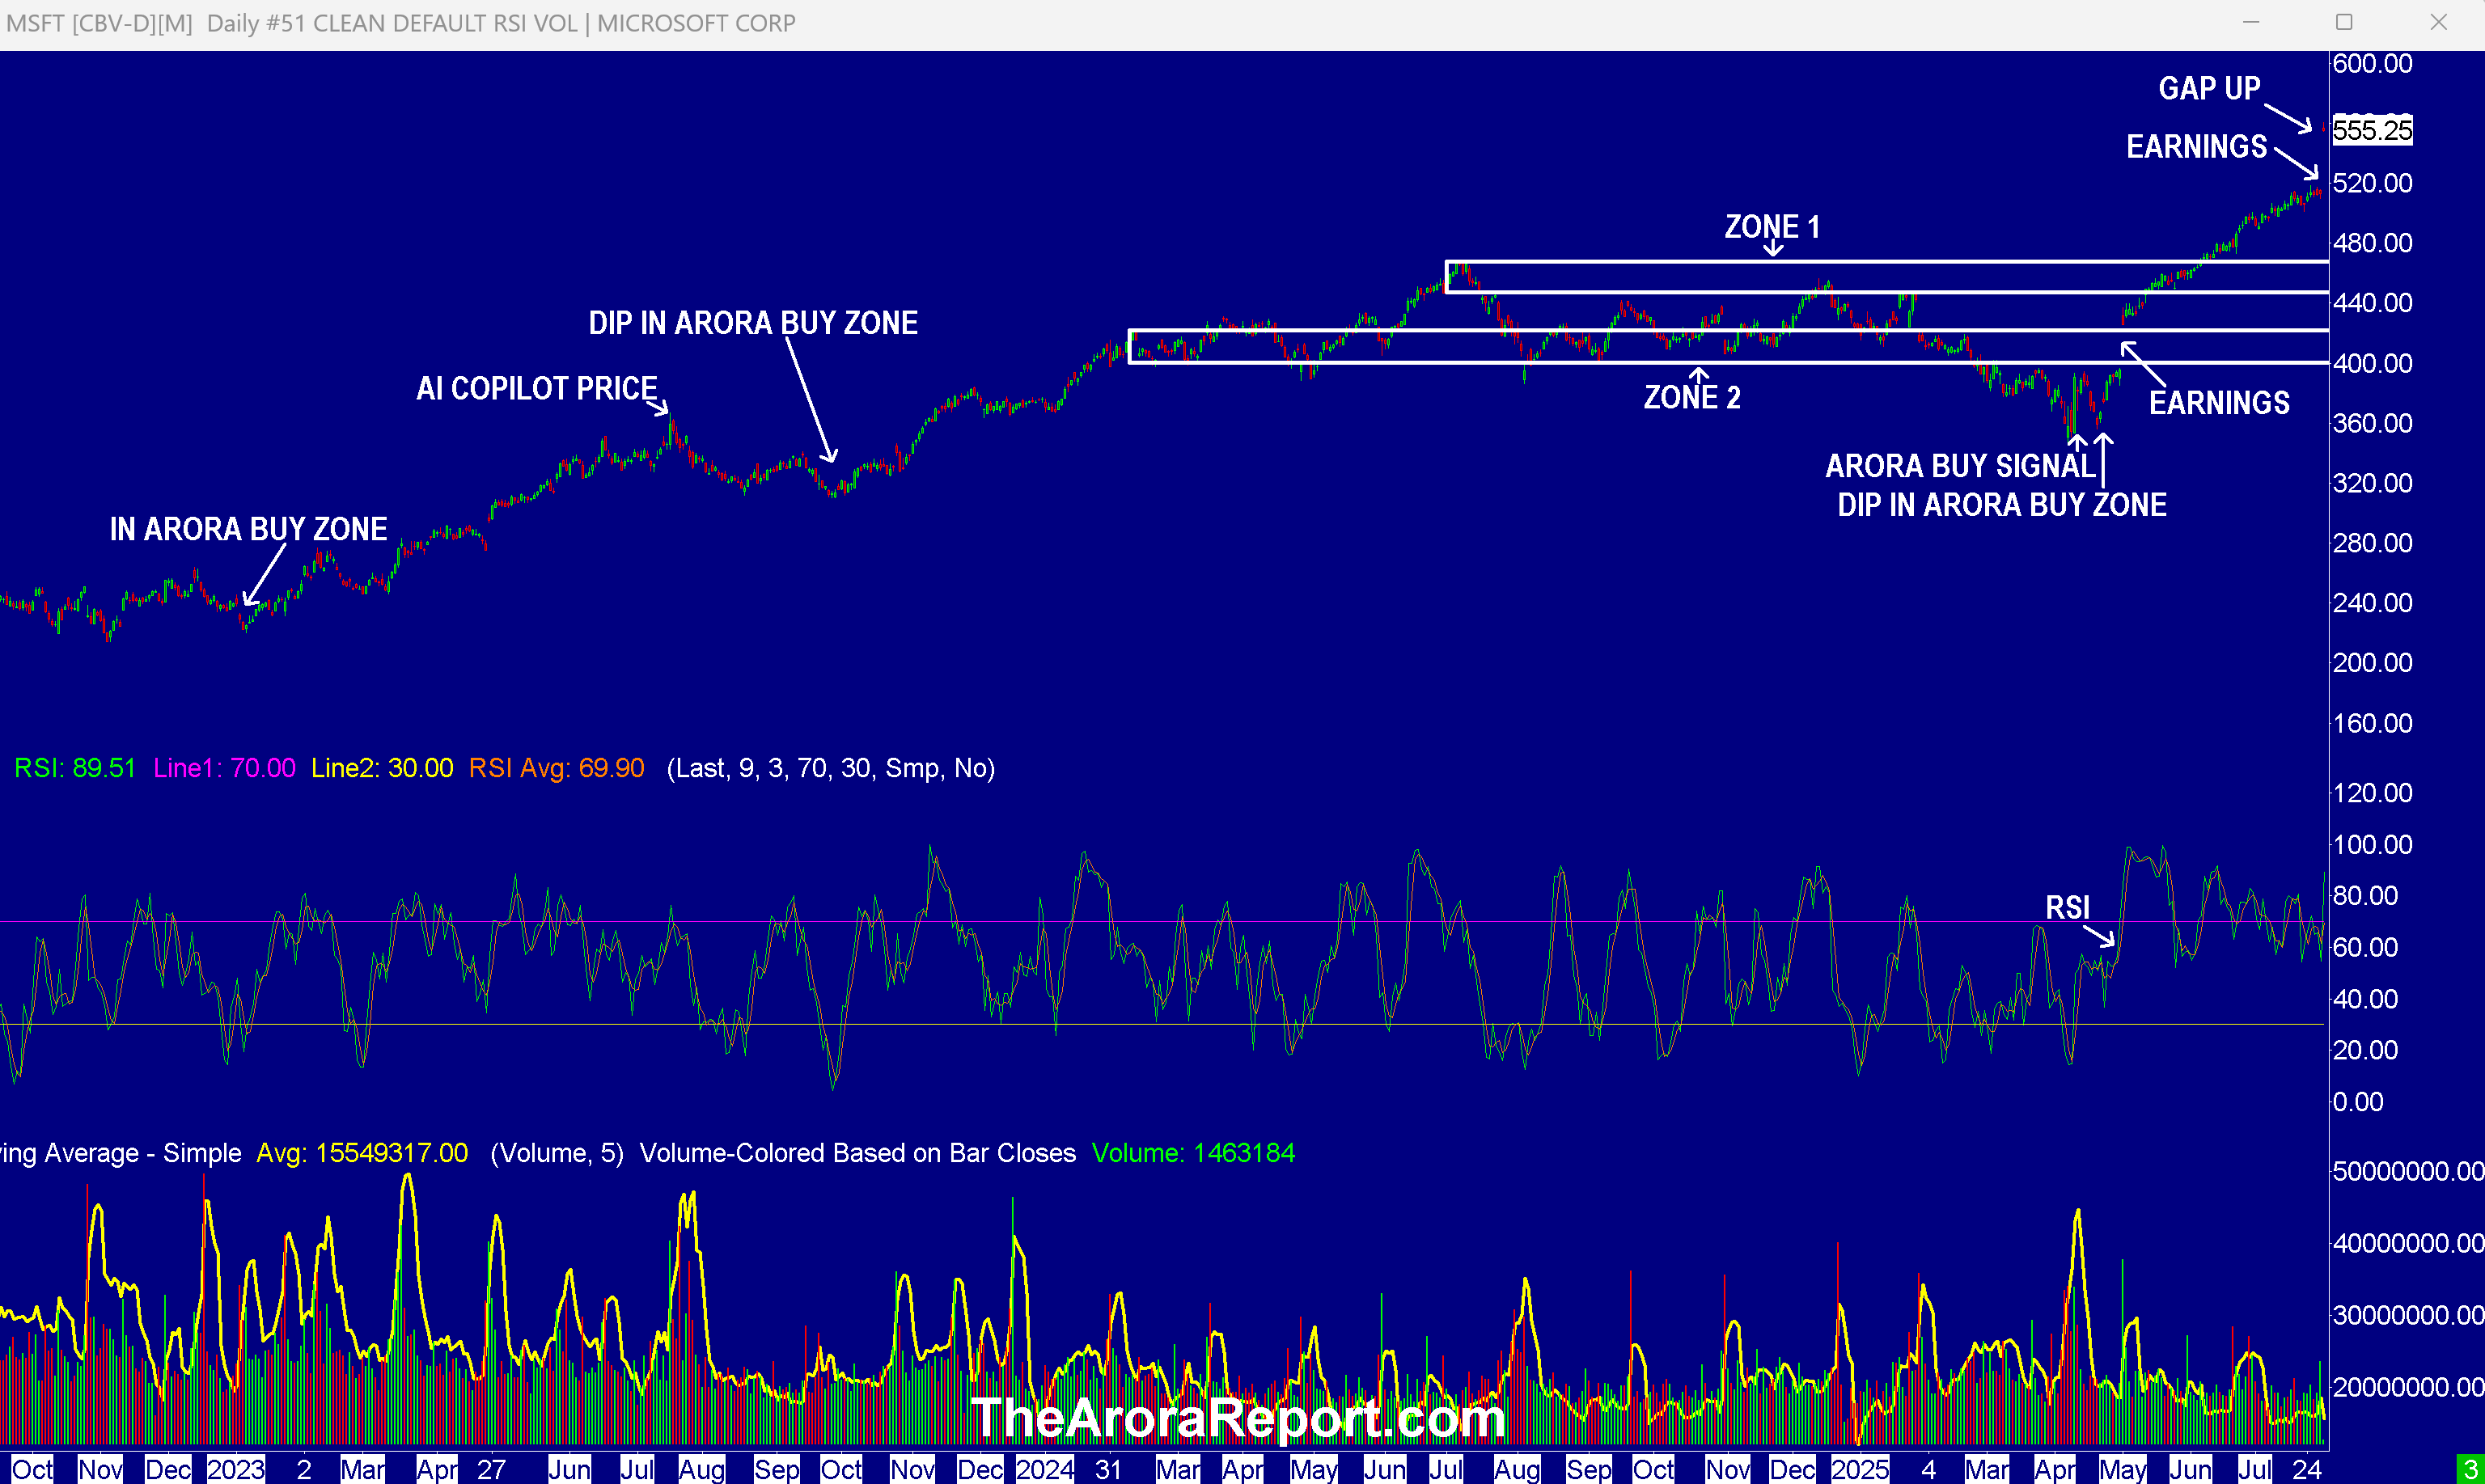
Please click here for an enlarged chart of Microsoft Corp (NASDAQ:MSFT).
Note the following:
- This article is about the big picture, not an individual stock. The chart of MSFT stock is being used to illustrate the point.
- The chart shows Microsoft earnings release yesterday.
- The chart shows the over 8% jump in MSFT stock on earnings release.
- RSI on the chart shows MSFT stock is now overbought. Overbought stocks are susceptible to a pullback.
- Microsoft earnings were the best in recent memory.
- Meta Platforms Inc (META) also reported the best earnings in recent memory.
- Here are the important implications for the AI trade of the stellar earnings from Microsoft and Meta:
- With continued spending on AI and infrastructure, these companies are transitioning from "asset-light" to "asset-heavy" companies. Becoming asset-heavy will make these companies more cyclical compared to the past. Being cyclical is fine as long as the economy is robust. However, in a recession, the pullback in these stocks will be much sharper compared to the past.
- This means investors, now more than ever, need to be adept at dynamic hedging and taking partial profits into strength.
- Most investors are already familiar with the concepts of artificial intelligence and artificial general intelligence. There is a high probability that the concept of artificial super intelligence may take hold.
- Traditionally, Meta and Microsoft have spent about 15% – 20% of their revenues on capital expenditures. Now, they are on track to spend about 30%. In the short term, this is good for companies such as NVIDIA Corp (NVDA), Advanced Micro Devices Inc (AMD), Broadcom Inc (AVGO), Micron Technology Inc (MU), and Vertiv Holdings Co (VRT). However, at some point, this spend will decline, exposing investors' positions in stocks like NVDA to a very large risk to the downside.
- With continued spending on AI and infrastructure, these companies are transitioning from "asset-light" to "asset-heavy" companies. Becoming asset-heavy will make these companies more cyclical compared to the past. Being cyclical is fine as long as the economy is robust. However, in a recession, the pullback in these stocks will be much sharper compared to the past.
- Amazon.com, Inc. (AMZN) and Apple Inc (AAPL) will report earnings today after the regular session close.
- The U.S. economy is 70% consumer based. For this reason, prudent investors pay attention to personal income and personal spending. Personal spending dropped. This is inline with the other data of the consumer pulling back that we have been sharing with you. Here are the details:
- Personal spending came at 0.3% vs. 0.4% consensus.
- Personal income came at 0.3% vs. 0.3% consensus.
- We previously shared with you that economists have become good at predicting the Fed’s favorite inflation gauge PCE. PCE data came as expected. Here are the details:
- Headline PCE came at 0.3% vs. 0.3% consensus.
- Core PCE came at 0.3% vs. 0.3% consensus.
- Initial jobless claims came at 218K vs. 220K consensus.
Magnificent Seven Money Flows
In the early trade, money flows are positive in Amazon (AMZN), Meta (META), Microsoft (MSFT), NVIDIA Corp (NVDA), and Tesla Inc (TSLA).
In the early trade, money flows are neutral in Apple (AAPL) and Alphabet Inc Class C (GOOG).
In the early trade, money flows are positive in SPDR S&P 500 ETF Trust (SPY) and Invesco QQQ Trust Series 1 (QQQ).
Momo Crowd And Smart Money In Stocks
Investors can gain an edge by knowing money flows in SPY and QQQ. Investors can get a bigger edge by knowing when smart money is buying stocks, gold, and oil. The most popular ETF for gold is SPDR Gold Trust (GLD). The most popular ETF for silver is iShares Silver Trust (SLV). The most popular ETF for oil is United States Oil ETF (USO).
Bitcoin
Bitcoin is range bound.
What To Do Now
Consider continuing to hold good, very long term, existing positions. Based on individual risk preference, consider a protection band consisting of cash or Treasury bills or short-term tactical trades as well as short to medium term hedges and short term hedges. This is a good way to protect yourself and participate in the upside at the same time.
You can determine your protection bands by adding cash to hedges. The high band of the protection is appropriate for those who are older or conservative. The low band of the protection is appropriate for those who are younger or aggressive. If you do not hedge, the total cash level should be more than stated above but significantly less than cash plus hedges.
A protection band of 0% would be very bullish and would indicate full investment with 0% in cash. A protection band of 100% would be very bearish and would indicate a need for aggressive protection with cash and hedges or aggressive short selling.
It is worth reminding that you cannot take advantage of new upcoming opportunities if you are not holding enough cash. When adjusting hedge levels, consider adjusting partial stop quantities for stock positions (non ETF); consider using wider stops on remaining quantities and also allowing more room for high beta stocks. High beta stocks are the ones that move more than the market.
Traditional 60/40 Portfolio
Probability based risk reward adjusted for inflation does not favor long duration strategic bond allocation at this time.
Those who want to stick to traditional 60% allocation to stocks and 40% to bonds may consider focusing on only high quality bonds and bonds of five year duration or less. Those willing to bring sophistication to their investing may consider using bond ETFs as tactical positions and not strategic positions at this time.
Posted-In: contributors Expert IdeasEarnings Equities Opinion Trading Ideas