-

A Powerful Contrarian Indicator Signals Now Is The Time To Sell: Bullishness Among US Individual Investors Hits November 2021 Highs
Thursday, June 15, 2023 - 5:25pm | 578Read More...Individual investors are increasingly optimistic about the stock market, according to the latest American Association of Individual Investors (AAII) Sentiment Survey. The AAII Sentiment Survey is a widely recognized poll that evaluates individual investors’ sentiments or opinions about the...
-

24-Year-Old Stock Trader Reveals The 4 Key Indicators Behind His Impressive $8M Earnings In Two Years
Tuesday, May 30, 2023 - 4:00pm | 809Read More...Starting your journey in stock trading at a young age means you can learn the intricacies of the market, understand various trading strategies, and become familiar with different types of financial instruments. This is what 24-year-old Jack Kellogg did, by beginning his stock trading journey...
-

The 5 Best Elliott Wave Indicators
Friday, September 23, 2022 - 9:50am | 549Read More...In essence, Elliott Waves describes price movements as alternating between impulsive phases that establish the direction of the trend and corrective phases that oppose the direction of the trend. It is a form of technical analysis that is based on investors sentiment and psychology. In a...
-
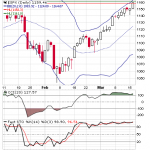
S&P 500 Large Cap Index ( SPX )
Wednesday, March 17, 2010 - 12:16am | 487Read More...Have a Happy St Paddy's Day One and All The S&P Large Cap Index ( NYSE:$SPX ) took a big step in the direction of reaching the terminal point of this Bear Market Rally . It will be fitting that the Top will come, I believe, on St Paddy's Day and also a Fibonacci 377 days since the March 6 ,...
-
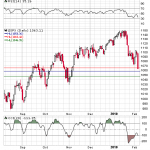
S&P 500 Index ($SPX) & S&P 500 SPDRs (SPY) - Swift and Brutal
Friday, February 5, 2010 - 12:54am | 416Read More...I said it many times. When the S&P 500 Index (NYSE:$SPX) reverses the action would be SWIFT and BRUTAL. Likewise the ETF- the S&P 500 SPDRs (NYSE: SPY) mimicked the action. The $SPX lost 34.17 points to close at 1063.11 and the SPY lost 3.39 to close at 106.44 as no mercy was shown to the...
-
Non-Trend Following Indicators or Oscillators
Tuesday, February 2, 2010 - 7:04am | 399Read More...The weakness of the moving average method is related to the calculation of buy/sell opportunities by working on past data. The slow prediction of buy/sell chances that are available is attributed to the problem of time lag that occurs as faster average (short-term average) takes longer to cross the...
-
Where Goes the SPX 500 ?
Monday, September 7, 2009 - 6:56pm | 301Read More...There are a multitude views on the subject . Depending on your time frame , the Index will either go Up or Down. In the short term there is , in my opinion, still some upside before we get a modest correction. Chart One : Daily SPX 500 This shows that since early July the price action of the...
