Microvision Needs To See A Bounce Here At Support

Microvision, Inc. (NASDAQ: MVIS) shares were trading lower Monday, although there looks to be no company-specific news to explain the dump in shares. The stock looks to be nearing potential support in a technical pattern today.
Microvision was down 3.36% at $14.36 at last check Tuesday.
Microvision Daily Chart Analysis
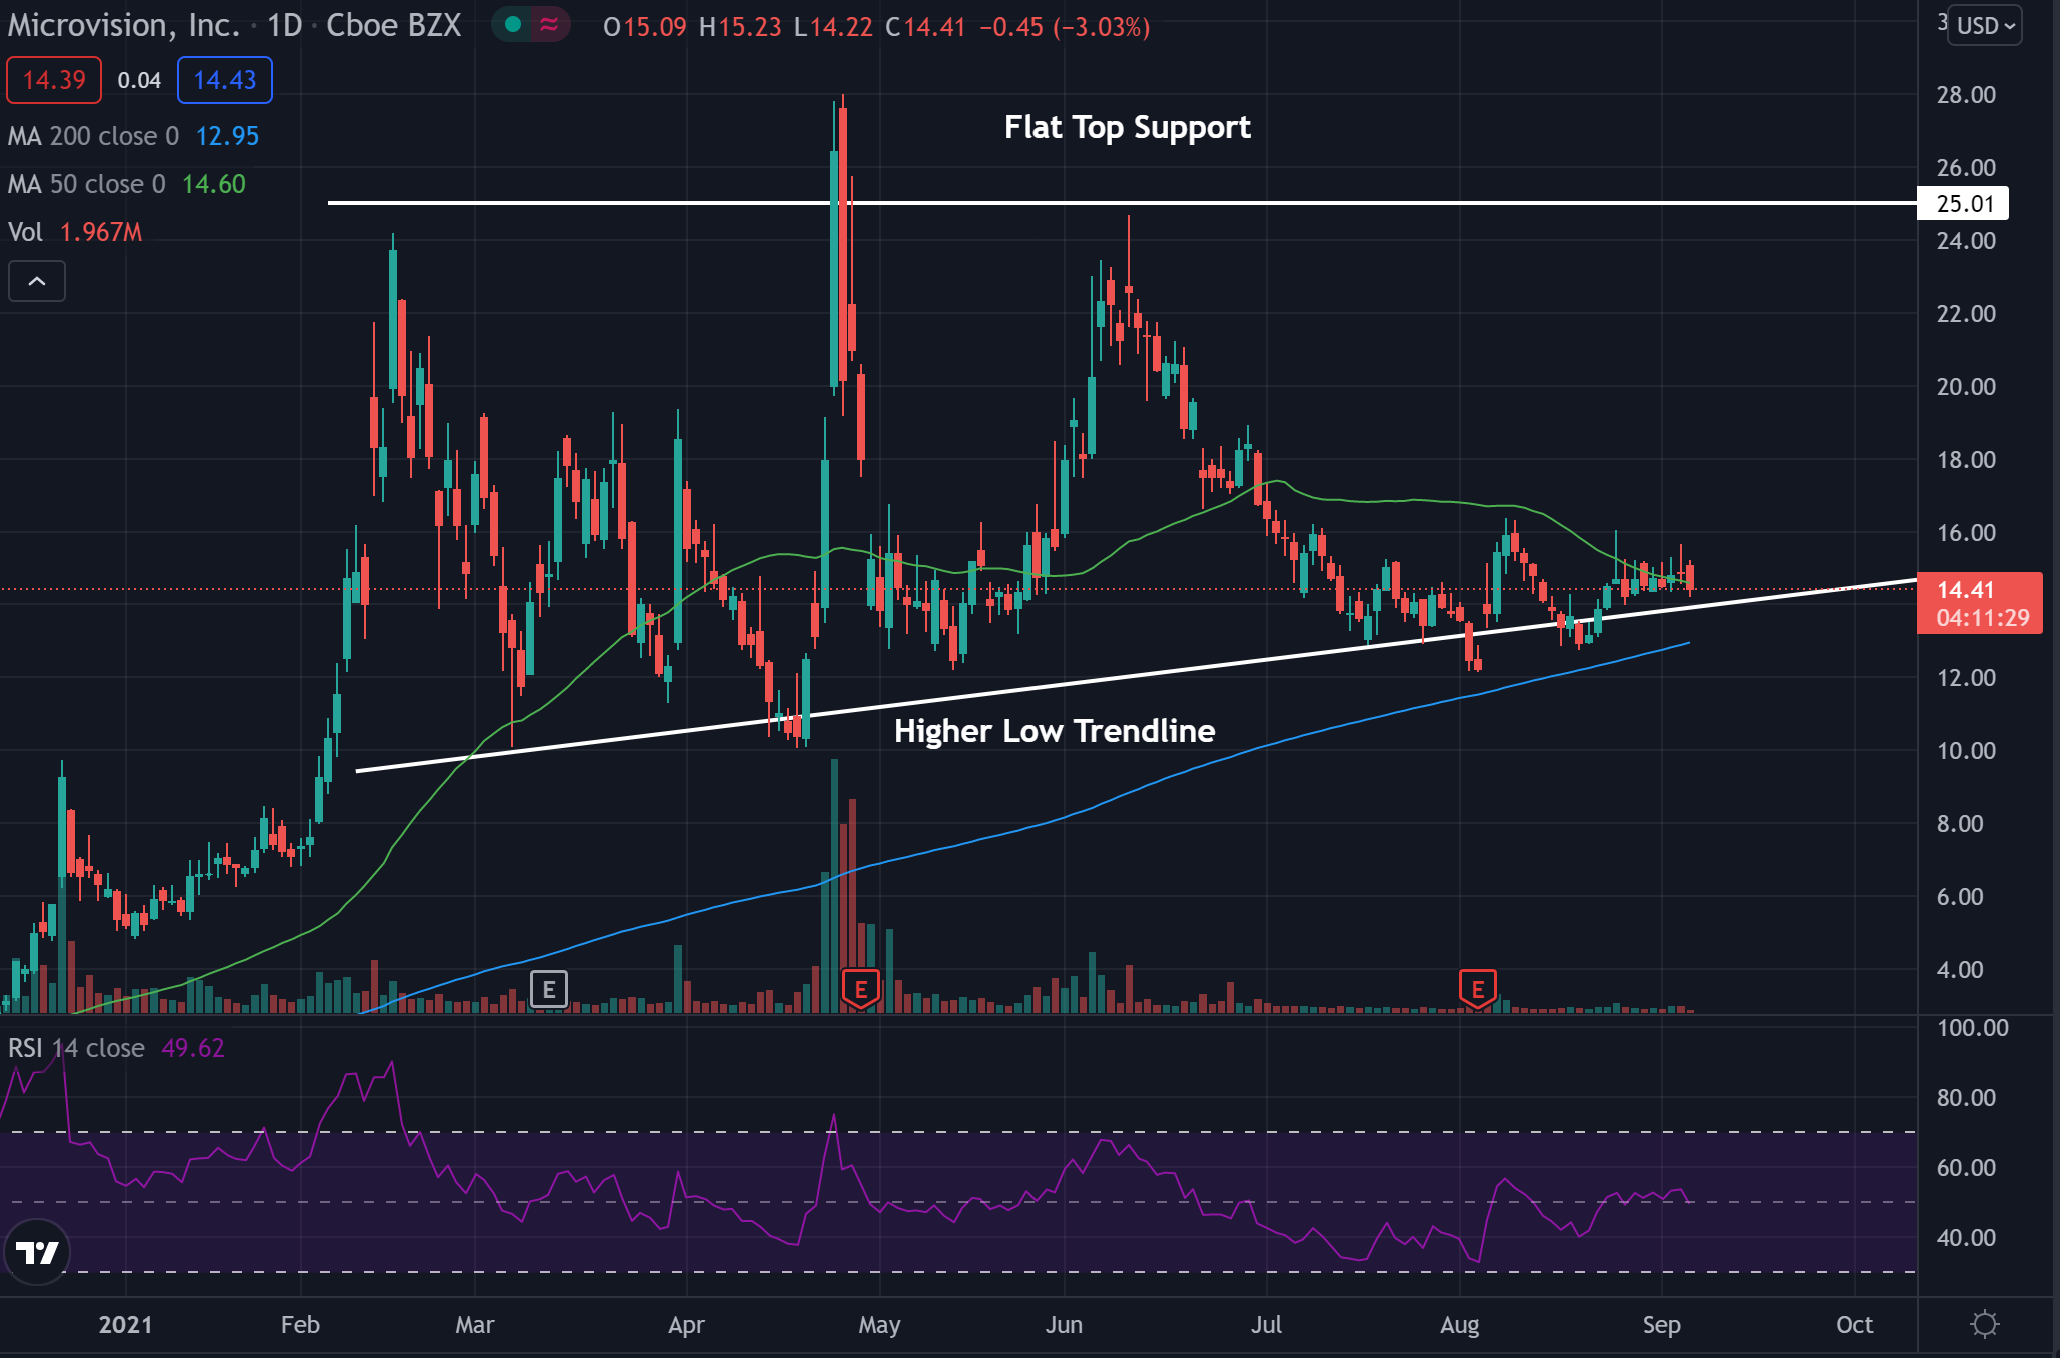
- The stock looks to be nearing support in what technical traders call an ascending triangle pattern.
- The $25 price level held as resistance in the past and may continue to in the future. The higher low trendline is somewhere the stock has always been able to find support and may continue to in the future.
- The stock trades below the 50-day moving average (green) but above the 200-day moving average (blue), indicating the stock is likely facing a period of consolidation.
- The 50-day moving average may hold as an area of resistance in the future, while the 200-day moving average could hold as support.
- The Relative Strength Index (RSI) has been moving sideways in the past few days and sits at 48. This shows there are relatively equal buyers and sellers in the stock, with slightly more sellers.
What’s Next For Microvision?
Bullish traders are looking to see the stock bounce off the support and begin to head higher. Bulls would then like to see the stock form higher lows up toward resistance and breakout eventually.
Bearish traders are looking to see the stock break below support and be able to hold below the level. If the stock can hold below the higher low trendline, then it may be ready to see a further push downward.
Photo by Michal Czyz on Unsplash
© 2025 Benzinga.com. Benzinga does not provide investment advice. All rights reserved.
Posted-In: LasersLong Ideas Short Ideas Technicals Tech Trading Ideas Best of Benzinga