Merck Shares Teetering On The Brink Of A Further Downside Correction

Merck & Co., Inc. (NYSE: MRK) has rewarded shareholders in the stock with a "triple" off of the $20.07 low set in March of 2009. With valuations for Merck getting stretched -- the dividend yield of half of what it was in 2009 and the technicals weakening -- can the bulls in the Merck arena get some help from the company or the market?
Let's take a look at the fundamentals and the technicals of Merck to get a better idea of the answer to that question.
What The Bulls See
- Inexpensive valuation metrics: An enterprise value of $167.76 billion versus the stock's market capitalization of $162 billion and a price-to-sales ratio of 3.82.
- Net profit margins of 28.82 percent that spin off approximately $12.45 billion in positive levered free cash flow annually.
- Strong management effectiveness metrics: A return on assets of 5.58 percent and a return on equity of 23.6 percent.
- Some healthy balance sheet metrics: A debt-to-equity ratio of only 43.9 percent and a current ratio of 1.77.
- A Treasury-beating 3.2 percent dividend yield
What The Bears See
- Cash of $15.72 billion which is dwarfed by the debt of $21.42 billion.
- Fairly rich valuation metrics: Merck sports a PE of around 15, which can be viewed as rich when compared to estimated revenue and EPS growth for next year of 4.4 percent and 12.4 percent, respectively (although the 12.4 percent EPS growth almost completely justifies the PE) and a price-to-book ratio of 3.32.
The Technical Take
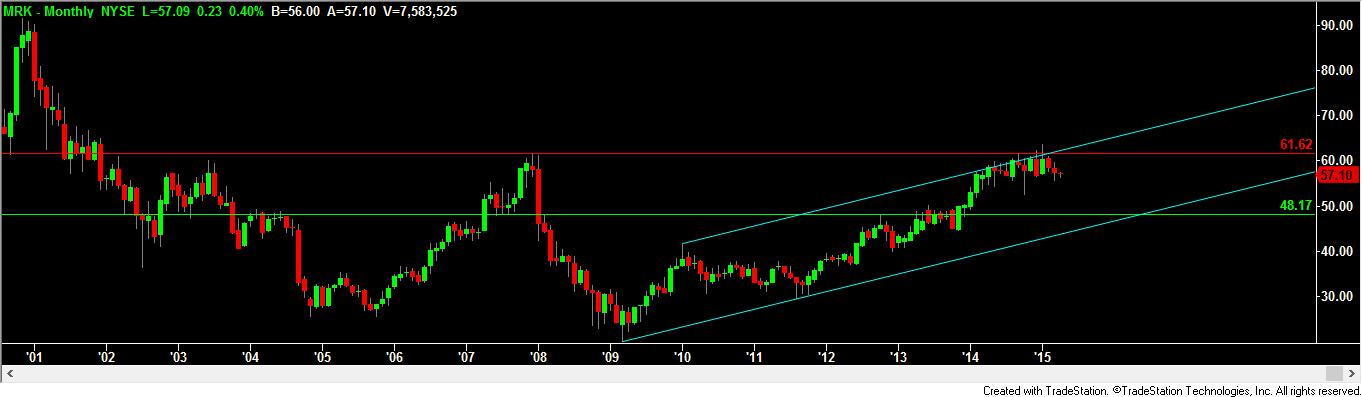
Technicians note that Merck has been trading right along the upper edge of the long-term uptrend channel ever since February 2014. The stock has just continued to climb along with that line, almost as if hanging on for the ride. The stock managed to hang onto that uptrend line all that time until the price finally reached the horizontal line resistance created by the December 2007 peak at $61.62.
Since trying and failing to break above that resistance, the stock has begun to falter just a bit. If the technicians were to extrapolate a test of the lower edge of the uptrend channel, it would mean that Merck is in store for a decline down to around $48, which would correspond with horizontal line support down at that level as well. Support above that level comes in at the October 2014 low of $52.89.
Overall…
Merck looks to technicians like it is ripe for a continued correction. Of course, any break and close above the $61.62 level on a monthly basis would likely lead to a quick shot higher as shorts would be running for cover.
Unless and until that happens, however, traders are likely to be leaning short on this trade as valuations, high debt and the technical arrows seem to all be pointing to a downside correction.

© 2025 Benzinga.com. Benzinga does not provide investment advice. All rights reserved.
Posted-In: merckShort Ideas Dividends Technicals Trading Ideas