Best Chart Set-Ups for Maximum Profits
Editor's Note: This is a guest post
Trading with price action can yield very high income for the smart investor, and can produce good profits on several FX pairs, futures and commodities. In this article we intend to describe few of the most consistent stock patterns for most gains.
Pattern: MA Bounce
The moving average test occurs when price touches a MA in the middle of a trend. It is a mere retracement that usually results in a continuation of the trend and an accurate location to join it. Make sure that the movement is strong by observing the direction of the moving average and making sure that it is trending and not flat (which shows weak trend).
Pattern: Channel Pattern
The channel pattern is a well-known set-up that can be seen on many FX pairs and Futures for dozens of years and generates big gains.
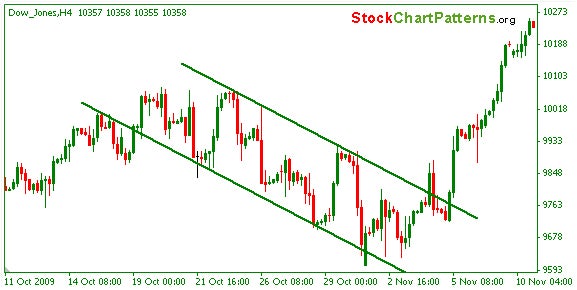
Channel pattern is built of two parallel trend lines that go in the same direction. We take long trades in an ascending channel and enter sell positions in a descending channel, to make sure we don't enter trades against the current trend. We may also take pullback trades when the set up is broken to the opposite direction, as it usually helps us gain from the new trend (reversal) from an early location.
Pattern: Support/Resistance Pullback
The S\R pullback is one of the best stock charts set-ups, as it has hit rate of 70%+ on dozens of FX pairs and stocks. The theory behind the pullback is that stock price breaks a support\resistance level and re-tests the boundary after the breakout. This allows traders to join the trend at a very accurate point, with small stop loss and high potential reward.
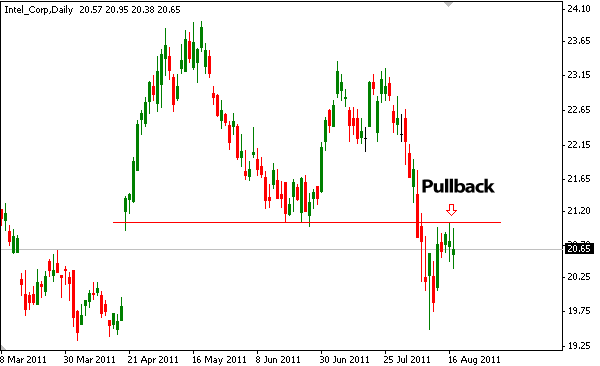
The pullback occurs in many stock patterns, such as the Double Bottom, Channel, Triangle, Head & Shoulders and many more.
Pattern: Double Top
The Double Top is a highly reliable stock pattern that has 76% hit rate in many charts, and is considered a very good bearish pattern.
Double Top occurs when price reaches the same resistance level twice, creating a price-action that shapes the letter M. Position is taken when stock price breaks the neckline downwards and begins to trend downwards, and we may join that movement at the breaking of the neckline or at a pullback.
All of those chart patterns are accurate, have a high success rate, and can be traded on any FX Pair, option chart or commodity. You don't need to be a stock trading professional to gain from these trading set-ups - just follow the general directions and you will quickly see that making money from trading is not so hard. Follow the set-ups shown here and do not deviate, as it will surely lead to failure.
Choose a pattern, follow it and master it - this is the easiest manner for trading success for the long-term.
Steve Sollheiser is a writer and a stock trader from StockChartPatterns.org.
The preceding article is from one of our external contributors. It does not represent the opinion of Benzinga and has not been edited.
© 2025 Benzinga.com. Benzinga does not provide investment advice. All rights reserved.
Posted-In: charts Double Top ForexTechnicals Topics Markets Trading Ideas General