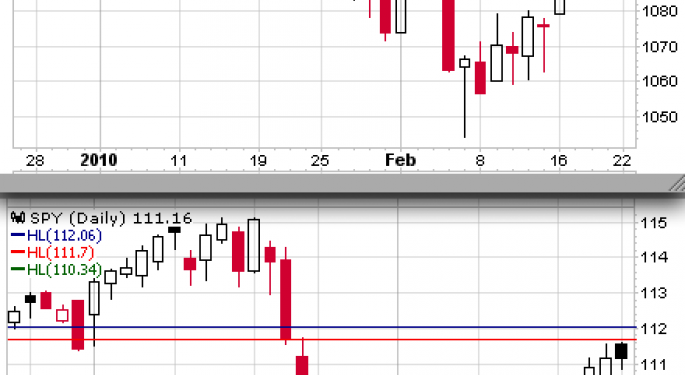
S&P 500 Index ( SPX ) and S&P SPDRs ( SPY ) Finish the Correction
The main action in the S&P 500 Index ( $SPX ) was essentially completed in the first hour of trading. After the Open at 1100.00 the Index rose to a lower high of 1112.29. In the process the Fibonacci level 1112.24 was tested and resulted in a failure.as the Index dropped below that level and continued down to 1105.38 where it stopped short of the Fibonacci level 1105.20 . In the last hour the Index again dropped down to the 1106 level but made a last minute recovery to Close at 1108.01 .
Perhaps the Index will complete the minor correction in the upcoming session. Look for a pullback to the 1000 - 1102 level. Then, if all is in alignment , the Index should make the last rise towards resistance at 1113 and 1122.
============================================================
S&P 500 Index ( $SPX ) Resistance and Support Levels
- R4- 1129.29
- R3- 1122.38
- FIB- 1121.80
- FIB- 1119.54
- R2- 1115.47
- FIB- 1113.63
- FIB- 1112.24
- R1- 1111.74
- FIB- 1110.84
- FIB- 1109.98
- DC- 1108.01
- FIB- 1105.20
- FIB- 1102.25
- S2- 1101.65
- S3- 1094.74
- S4- 1087.83
S1- 1104.83
=============================================================
S&P SPDRs ( SPY ) - Resistance and Support Levels
- R4- 113.76
- R3- 112.91
- FIB- 112.65
- FIB / R2- 112.06
- FIB- 111.70
- R1- 111.60
- DC- 111.13
- S1- 110.75
- FIB- 110.63
- S2- 110.36
- FIB- 110.34
- FIB- 109.86
- S3- 109.51<?\/li>
- S4- 108.66
© 2025 Benzinga.com. Benzinga does not provide investment advice. All rights reserved.
Posted-In: ETF Fibonacci IndexBroad U.S. Equity ETFs Technicals Intraday Update Markets ETFs


