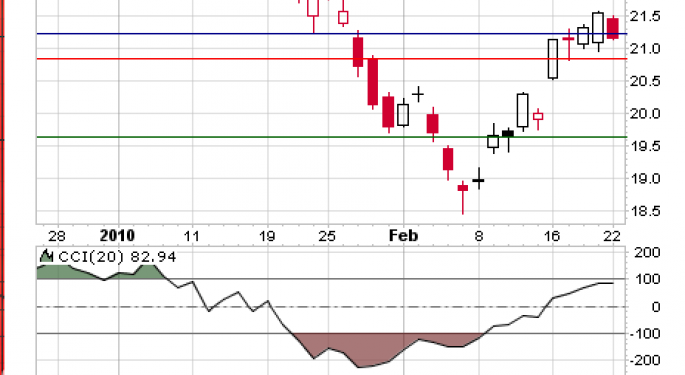
POWERSHARES DB BASE METALS FUND (DBB) - A Leader ?
From 1/06/2010 to 2/05/2010 the share price of PowerShares DB Base Metals Fund ( DBB:NYSE ) dropped 6.47 points from 23.94 to 18.47 . Then, in the period
2/05/2010 to 2/19/2010 the share price retraced to 21.57. This value is a retracement Fibonacci sub-level where a reversal would occur if the rise was completed.
A potential short term bearish " Flag " has been formed with the upper boundary at 21.75 and the lower boundary at 21.10. The Flag Pole has a potential height of 1.39 [ 21.14 - 19.75 ]. If this pattern is valid and plays out to the downside the potential target is 19.71 [ 21.10 - 1.39 ] . This fits quite well with a Fibonacci sub-level at 19.65 where, if a normal correction, the share price would reverse and continue to rise.
The technical indicators - RSI (14) , CCI (20) and the FSTO (14,3) are all in the process of turning down which is what one wants to see. In addition this last session produced an Inside Reversal Day .
So the question is will DBB be a leader when this final up-leg of the S&P 500 Index is completed and the long awaited correction finally takes place. If so and the pattern plays out then DBB has the potential as a good short candidate.
The Resistance and Support Levels for POWERSHARES DB BASE METALS FUND (DBB) are as follows:
- R4- 22.34
- R3- 21.98
- UFB- 21.75
- R2- 21.62
- RH- 21.57
- R1- 21.39
- DC- 21.15
- LFB- 21.10
- S1- 21.03
- S2- 20.90
- FIB- 20.84
- S3- 20.54
- FIB- 20.39
- S4- 20.18
- T1- 19.75
- FIB- 19.65
© 2025 Benzinga.com. Benzinga does not provide investment advice. All rights reserved.
Posted-In: Fibonacci Flag Flag PoleShort Ideas Technicals Markets Trading Ideas ETFs


