S&P 500 Large Cap Index ( SPX ) and S&P 500 SPDRs ( SPY )
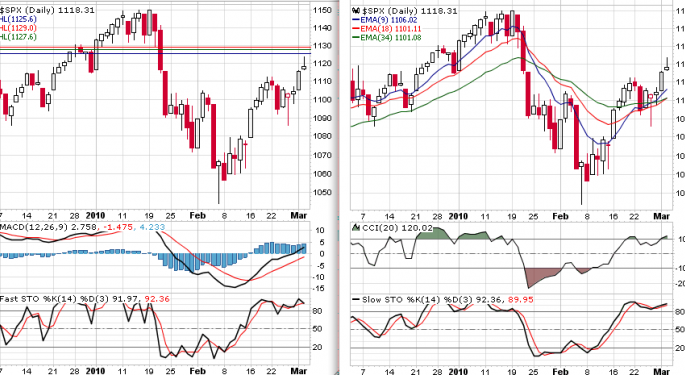
A potential " Shooting Star " was formed in the daily chart of the S&P 500 Index ( NYSE:$SPX ). This could mean that a reversal is at hand but there will need to be follow through to confirm the candlestick pattern.
The only indicator that is suggesting a reversal might be at hand is the Fast Stochastic ( 14, 3 ) where the %K has dropped below the %D but again that can be reversed very rapidly .
The CCI ( 20 ), SSTO ( 14, 3 ) and the MACD ( 12,26,9 ) all suggest that there may still be more upside before this last up leg of the Bear Market Rally is completed.
The EMAs have slowly but steadily been regaining their correct price order for a rising Index. In this last session the EMA 18 [ 1101.11 ] crossed above the EMA 34 [ 1101.08 ] . Should there be a reversal in the Index then that positive cross will quickly turn into a negative cross.
The Resistance at 1115 - 1116 was taken out and in this last session the Index tested the 1119 - 1121.5 zone of Resistance that includes the 50% retracement from the fall in the Index from 1576.09 - 666.79 . The test was negative with a close at 1118.31 .
If the TOP [ 1123.46 ] was set in the last session then the initial support will be at 1115± and then 1109. A break of 1109 will indicate that the reversal is underway and a break below 1100 should be confirmation of said event.
Now as many of the technical indicators suggest further upside the levels of Resistance will be 1119 - 1121.5 , then 1125.6 and 1127.6 . Beyond that lies 1129 and 1142 . In all likelihood a break above 1125 will involve a " spike " in the index price.
The S&P 500 SPDRs ( NYSE:SPY ) rose to a high of 112.74 before closing at 112.20 . SPY also formed a potentially bearish candlestick pattern - an " Evening Star " . Again follow through to downside is needed to confirm the pattern.
Now we just have to see what the Market Makers want to do in this coming session.
The calculated Resistance and Support Levels for the Index and the ETF SPY are given below.
S&P 500 Index ( NYSE:$SPX )
Resistance and Support Levels
- R4- 1140.28
- R3- 1133.33
- R2- 1126.38
- R1- 1122.34
- DC- 1118.31
- S1- 1115.39
- S2- 1112.48
- S3- 1105.53
- S4- 1098.58
===================
S&P 500 SPDRs ( NYSE:SPY )
Resistance and Support Levels
- R4- 114.53
- R3- 113.79
- R2- 113.05
- R1- 112.63
- DC- 112.20
- S1- 111.89
- S2- 111.57
- S3- 110.83
- S4- 110.09
© 2025 Benzinga.com. Benzinga does not provide investment advice. All rights reserved.
Posted-In: S&P 500 Large Cap Index S&P 500 SPDRs ETFBroad U.S. Equity ETFs Technicals Intraday Update Markets ETFs


